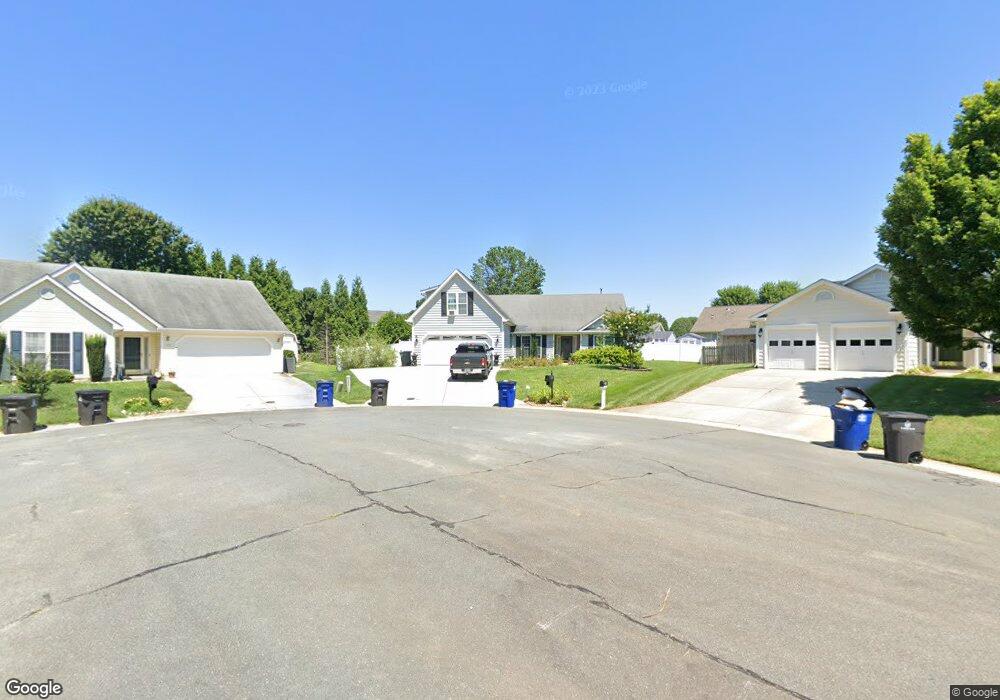
125 Drawbridge Ct Kernersville, NC 27284
Oak Garden NeighborhoodEstimated Value: $292,000 - $315,000
6
Beds
6
Baths
3,102
Sq Ft
$99/Sq Ft
Est. Value
About This Home
This home is located at 125 Drawbridge Ct, Kernersville, NC 27284 and is currently estimated at $305,683, approximately $98 per square foot. 125 Drawbridge Ct is a home located in Forsyth County with nearby schools including Sedge Garden Elementary School, Southeast Middle School, and R.B. Glenn High School.
Ownership History
Date
Name
Owned For
Owner Type
Purchase Details
Closed on
Aug 16, 2021
Sold by
Mcdonald Tammy Sue and Price Tammy Mcdonald
Bought by
Mcdonald Tammy Sue
Current Estimated Value
Home Financials for this Owner
Home Financials are based on the most recent Mortgage that was taken out on this home.
Original Mortgage
$137,000
Outstanding Balance
$115,082
Interest Rate
2.9%
Mortgage Type
New Conventional
Estimated Equity
$190,601
Purchase Details
Closed on
Jan 28, 2008
Sold by
Price Michael Decal
Bought by
Price Tammy Mcdonald
Purchase Details
Closed on
Feb 7, 2002
Sold by
Greensboro D R Horton Inc
Bought by
Price Michael Decal and Mcdonald Tammy Sue
Home Financials for this Owner
Home Financials are based on the most recent Mortgage that was taken out on this home.
Original Mortgage
$149,119
Interest Rate
7.02%
Mortgage Type
FHA
Create a Home Valuation Report for This Property
The Home Valuation Report is an in-depth analysis detailing your home's value as well as a comparison with similar homes in the area
Home Values in the Area
Average Home Value in this Area
Purchase History
| Date | Buyer | Sale Price | Title Company |
|---|---|---|---|
| Mcdonald Tammy Sue | -- | Accommodation | |
| Mcdonald Tammy Sue | -- | Vantage Point Title | |
| Price Tammy Mcdonald | -- | None Available | |
| Price Michael Decal | $152,000 | -- |
Source: Public Records
Mortgage History
| Date | Status | Borrower | Loan Amount |
|---|---|---|---|
| Open | Mcdonald Tammy Sue | $137,000 | |
| Closed | Mcdonald Tammy Sue | $137,000 | |
| Previous Owner | Price Michael Decal | $149,119 |
Source: Public Records
Tax History Compared to Growth
Tax History
| Year | Tax Paid | Tax Assessment Tax Assessment Total Assessment is a certain percentage of the fair market value that is determined by local assessors to be the total taxable value of land and additions on the property. | Land | Improvement |
|---|---|---|---|---|
| 2025 | $2,710 | $278,700 | $50,000 | $228,700 |
| 2024 | $2,587 | $193,200 | $38,000 | $155,200 |
| 2023 | $2,587 | $193,200 | $38,000 | $155,200 |
| 2022 | $2,538 | $193,200 | $38,000 | $155,200 |
| 2021 | $2,493 | $193,200 | $38,000 | $155,200 |
| 2020 | $2,237 | $163,500 | $28,000 | $135,500 |
| 2019 | $2,253 | $162,000 | $0 | $0 |
| 2018 | $2,140 | $163,500 | $28,000 | $135,500 |
| 2016 | $1,979 | $150,424 | $25,200 | $125,224 |
| 2015 | $1,949 | $150,424 | $25,200 | $125,224 |
| 2014 | $1,866 | $148,544 | $25,200 | $123,344 |
Source: Public Records
Map
Nearby Homes
- 210 Silver Creek Trail
- 1740 Beeson Park Ln
- 345 Silver Creek Trail
- 1541 Pecan Ln
- 1547 Pecan Ln
- 205 Fiddlers Knoll Ct
- 915 Mayford Dr
- 1100 Kingswood Dr
- 1105 Kingswood Dr
- 475 Silver Creek Trail
- 900 Biloxi Ave
- 865 Sedge Garden Rd
- 130 Birch Hill Ct
- 244 Fiddlers Knoll Ct
- 991 Beesons Field Dr
- 1150 Somerset Crossing Ln
- 1525 Fiddlers Knoll Dr
- 5204 Sedge Hollow Dr
- 5179 Sedge Hollow Dr
- 1206 Land Grove Ct
- 135 Drawbridge Ct
- 115 Drawbridge Ct
- 1100 Brookgreen Ln
- 1110 Brookgreen Ln
- 121 Silver Creek Trail
- 137 Silver Creek Trail
- 1120 Brookgreen Ln
- 153 Silver Creek Trail
- 105 Silver Creek Trail
- 120 Drawbridge Ct
- 105 Drawbridge Ct
- 110 Drawbridge Ct
- 1130 Brookgreen Ln
- 169 Silver Creek Trail
- 100 Drawbridge Ct
- 105 Brookgreen Ct
- 185 Silver Creek Trail
- 1080 Brookgreen Ln
- 1095 Brookgreen Ln
- 1670 Beeson Park Ln