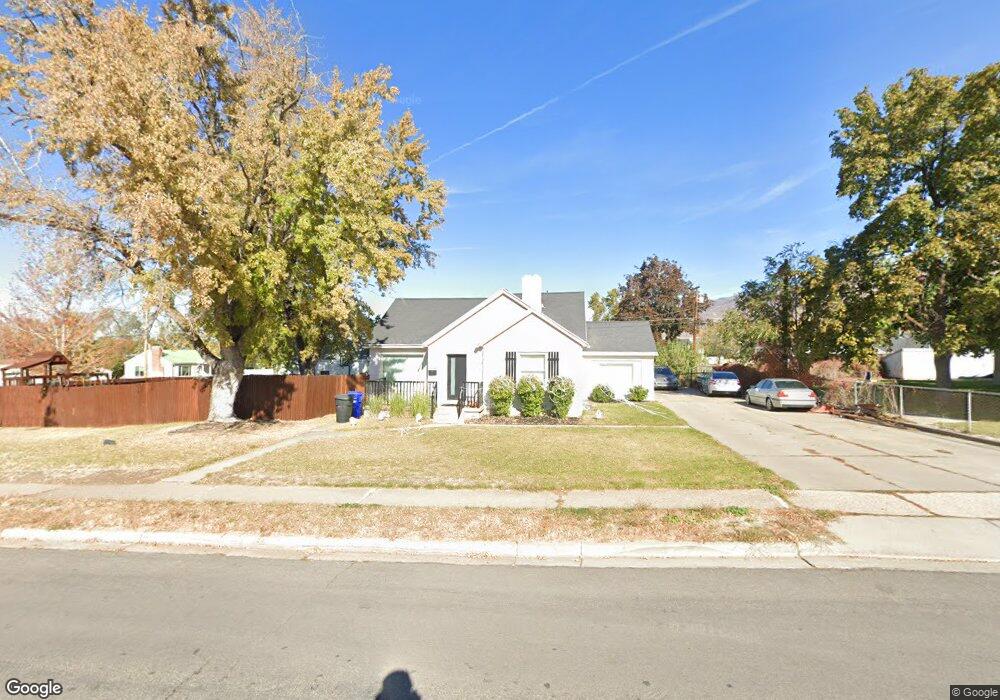
125 E 1200 S Bountiful, UT 84010
Estimated Value: $506,000 - $747,000
4
Beds
2
Baths
2,436
Sq Ft
$243/Sq Ft
Est. Value
About This Home
This home is located at 125 E 1200 S, Bountiful, UT 84010 and is currently estimated at $592,821, approximately $243 per square foot. 125 E 1200 S is a home located in Davis County with nearby schools including Bountiful Elementary School, Millcreek Junior High School, and Bountiful High School.
Ownership History
Date
Name
Owned For
Owner Type
Purchase Details
Closed on
Sep 8, 2023
Sold by
Neve Matthew Scott
Bought by
Fleck Chandra
Current Estimated Value
Home Financials for this Owner
Home Financials are based on the most recent Mortgage that was taken out on this home.
Original Mortgage
$532,000
Outstanding Balance
$519,356
Interest Rate
6.81%
Mortgage Type
Construction
Estimated Equity
$73,465
Purchase Details
Closed on
Aug 25, 2023
Sold by
Neve Lynsi Flloalulo
Bought by
Neve Matthew Scott
Home Financials for this Owner
Home Financials are based on the most recent Mortgage that was taken out on this home.
Original Mortgage
$532,000
Outstanding Balance
$519,356
Interest Rate
6.81%
Mortgage Type
Construction
Estimated Equity
$73,465
Purchase Details
Closed on
Nov 30, 2018
Sold by
Neve Matthew Scott
Bought by
Neve Matthew Scott
Home Financials for this Owner
Home Financials are based on the most recent Mortgage that was taken out on this home.
Original Mortgage
$50,800
Interest Rate
4.8%
Mortgage Type
New Conventional
Purchase Details
Closed on
Apr 7, 2004
Sold by
Neve Arrin Mamie and Neve Arrin M
Bought by
Neve Matthew Scott
Purchase Details
Closed on
Mar 15, 2004
Sold by
Neve Arrin Mamie
Bought by
Neve Matthew Scott
Purchase Details
Closed on
Aug 27, 2001
Sold by
Neve Matthew S
Bought by
Neve Matthew S and Neve Arrin M
Home Financials for this Owner
Home Financials are based on the most recent Mortgage that was taken out on this home.
Original Mortgage
$142,000
Interest Rate
7.09%
Purchase Details
Closed on
Apr 24, 2000
Sold by
Tingey Melvin J and Tingey Esther Mitton
Bought by
Neve Matthew S and Neve Arrin M
Home Financials for this Owner
Home Financials are based on the most recent Mortgage that was taken out on this home.
Original Mortgage
$142,100
Interest Rate
8.24%
Purchase Details
Closed on
Jan 25, 1999
Sold by
Tingey Melvin J
Bought by
Tingey Melvin J and Tingey Esther
Home Financials for this Owner
Home Financials are based on the most recent Mortgage that was taken out on this home.
Original Mortgage
$135,500
Interest Rate
6.63%
Purchase Details
Closed on
Sep 5, 1997
Sold by
Tingey Melvin J
Bought by
Tingey Melvin J and Tingey Esther Mitton
Home Financials for this Owner
Home Financials are based on the most recent Mortgage that was taken out on this home.
Original Mortgage
$131,886
Interest Rate
7.42%
Mortgage Type
FHA
Create a Home Valuation Report for This Property
The Home Valuation Report is an in-depth analysis detailing your home's value as well as a comparison with similar homes in the area
Purchase History
| Date | Buyer | Sale Price | Title Company |
|---|---|---|---|
| Fleck Chandra | -- | First American Title Insurance | |
| Neve Matthew Scott | -- | First American Title Insurance | |
| Neve Matthew Scott | -- | First American Title | |
| Neve Matthew Scott | -- | -- | |
| Neve Matthew Scott | -- | -- | |
| Neve Matthew S | -- | Reliable Title Company | |
| Neve Matthew S | -- | Reliable Title Company | |
| Neve Matthew S | -- | United Title Services | |
| Tingey Melvin J | -- | First American Title Co | |
| Tingey Melvin J | -- | First American Title Co | |
| Tingey Melvin J | -- | Security Title Company | |
| Tingey Melvin J | -- | Security Title Company |
Source: Public Records
Mortgage History
| Date | Status | Borrower | Loan Amount |
|---|---|---|---|
| Open | Fleck Chandra | $532,000 | |
| Closed | Neve Matthew Scott | $1,013 | |
| Previous Owner | Neve Matthew Scott | $50,800 | |
| Previous Owner | Neve Matthew S | $142,000 | |
| Previous Owner | Neve Matthew S | $142,100 | |
| Previous Owner | Tingey Melvin J | $135,500 | |
| Previous Owner | Tingey Melvin J | $131,886 |
Source: Public Records
Tax History
| Year | Tax Paid | Tax Assessment Tax Assessment Total Assessment is a certain percentage of the fair market value that is determined by local assessors to be the total taxable value of land and additions on the property. | Land | Improvement |
|---|---|---|---|---|
| 2025 | $3,127 | $278,300 | $141,848 | $136,452 |
| 2024 | $2,918 | $269,500 | $131,945 | $137,555 |
| 2023 | $2,599 | $238,150 | $130,837 | $107,312 |
| 2022 | $2,752 | $252,450 | $128,610 | $123,840 |
| 2021 | $2,608 | $355,000 | $168,519 | $186,481 |
| 2020 | $2,287 | $283,000 | $142,102 | $140,898 |
| 2019 | $2,140 | $267,000 | $138,067 | $128,933 |
| 2018 | $1,946 | $244,000 | $135,076 | $108,924 |
| 2016 | $1,624 | $117,150 | $59,544 | $57,606 |
| 2015 | $1,569 | $106,590 | $59,544 | $47,046 |
| 2014 | $1,668 | $117,961 | $59,544 | $58,417 |
| 2013 | -- | $99,583 | $43,242 | $56,341 |
Source: Public Records
Map
Nearby Homes
- 285 E 1100 S
- 141 E 1650 S
- 380 E 1500 S
- 545 S 100 E
- 288 E 1650 S
- 1350 S 200 W
- 650 S Main St Unit 6206
- 650 S Main St Unit 4104
- 650 S Main St Unit 9106
- 323 Peach Ln
- 275 E Peach Ln S
- 1314 S 200 W Unit 19
- 1820 S 50 W
- 520 S Orchard Dr Unit 17
- 190 W 1800 S
- 34 W 400 S
- 456 E 500 S
- 255 E 400 S
- 32 W 400 S
- 357 S 100 E
Your Personal Tour Guide
Ask me questions while you tour the home.