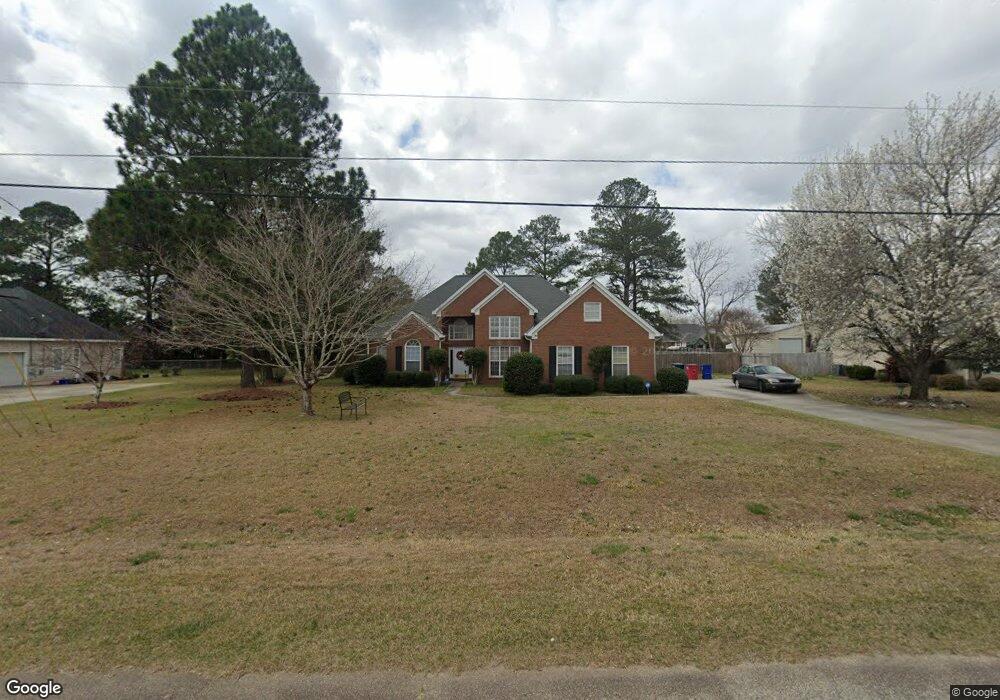
125 Ellis Way Macon, GA 31216
Estimated Value: $261,000 - $278,000
3
Beds
2
Baths
1,953
Sq Ft
$138/Sq Ft
Est. Value
About This Home
This home is located at 125 Ellis Way, Macon, GA 31216 and is currently estimated at $268,857, approximately $137 per square foot. 125 Ellis Way is a home located in Bibb County with nearby schools including Porter Elementary School, Rutland Middle School, and Rutland High School.
Ownership History
Date
Name
Owned For
Owner Type
Purchase Details
Closed on
May 2, 2007
Sold by
The Bank Of New York Co Na
Bought by
Brint Pamela Paulette
Current Estimated Value
Home Financials for this Owner
Home Financials are based on the most recent Mortgage that was taken out on this home.
Original Mortgage
$142,000
Outstanding Balance
$85,290
Interest Rate
6.12%
Mortgage Type
Purchase Money Mortgage
Estimated Equity
$183,567
Purchase Details
Closed on
Jan 2, 2007
Sold by
Morris Alton L and Morris Kecia N
Bought by
The Bank Of New York Co Na and Jpmorgan Chase Bank Na
Purchase Details
Closed on
Mar 31, 2006
Sold by
Iuliucci Daniel L and Iuliucci Christy W
Bought by
Morris Alton L and Morris Kecia N
Home Financials for this Owner
Home Financials are based on the most recent Mortgage that was taken out on this home.
Original Mortgage
$142,500
Interest Rate
8.85%
Mortgage Type
Adjustable Rate Mortgage/ARM
Create a Home Valuation Report for This Property
The Home Valuation Report is an in-depth analysis detailing your home's value as well as a comparison with similar homes in the area
Home Values in the Area
Average Home Value in this Area
Purchase History
| Date | Buyer | Sale Price | Title Company |
|---|---|---|---|
| Brint Pamela Paulette | $142,000 | None Available | |
| The Bank Of New York Co Na | $127,500 | None Available | |
| Morris Alton L | $150,000 | None Available |
Source: Public Records
Mortgage History
| Date | Status | Borrower | Loan Amount |
|---|---|---|---|
| Open | Brint Pamela Paulette | $142,000 | |
| Previous Owner | Morris Alton L | $142,500 |
Source: Public Records
Tax History Compared to Growth
Tax History
| Year | Tax Paid | Tax Assessment Tax Assessment Total Assessment is a certain percentage of the fair market value that is determined by local assessors to be the total taxable value of land and additions on the property. | Land | Improvement |
|---|---|---|---|---|
| 2025 | $2,520 | $109,552 | $14,000 | $95,552 |
| 2024 | $2,257 | $95,884 | $14,000 | $81,884 |
| 2023 | $1,425 | $81,118 | $14,000 | $67,118 |
| 2022 | $2,525 | $79,938 | $8,378 | $71,560 |
| 2021 | $2,384 | $69,724 | $7,040 | $62,684 |
| 2020 | $2,236 | $64,582 | $6,336 | $58,246 |
| 2019 | $2,118 | $61,105 | $5,632 | $55,473 |
| 2018 | $3,257 | $58,331 | $5,632 | $52,699 |
| 2017 | $1,829 | $55,822 | $5,896 | $49,926 |
| 2016 | $1,689 | $55,822 | $5,896 | $49,926 |
| 2015 | $1,984 | $47,501 | $5,896 | $41,604 |
| 2014 | $1,987 | $47,501 | $5,896 | $41,604 |
Source: Public Records
Map
Nearby Homes
- 129 Ellis Way
- 124 Stonefield Cir
- 117 Ellis Way
- 120 Stonefield Cir
- 130 Stonefield Cir
- 133 Ellis Way
- 124 Ellis Way
- 120 Ellis Way
- 130 Ellis Way
- 116 Stonefield Cir
- 134 Stonefield Cir
- 113 Ellis Way
- 116 Ellis Way
- 112 Stonefield Cir
- 137 Ellis Way
- 138 Stonefield Cir
- 112 Ellis Way
- 138 Ellis Way
- 109 Ellis Way
- 142 Stonefield Cir