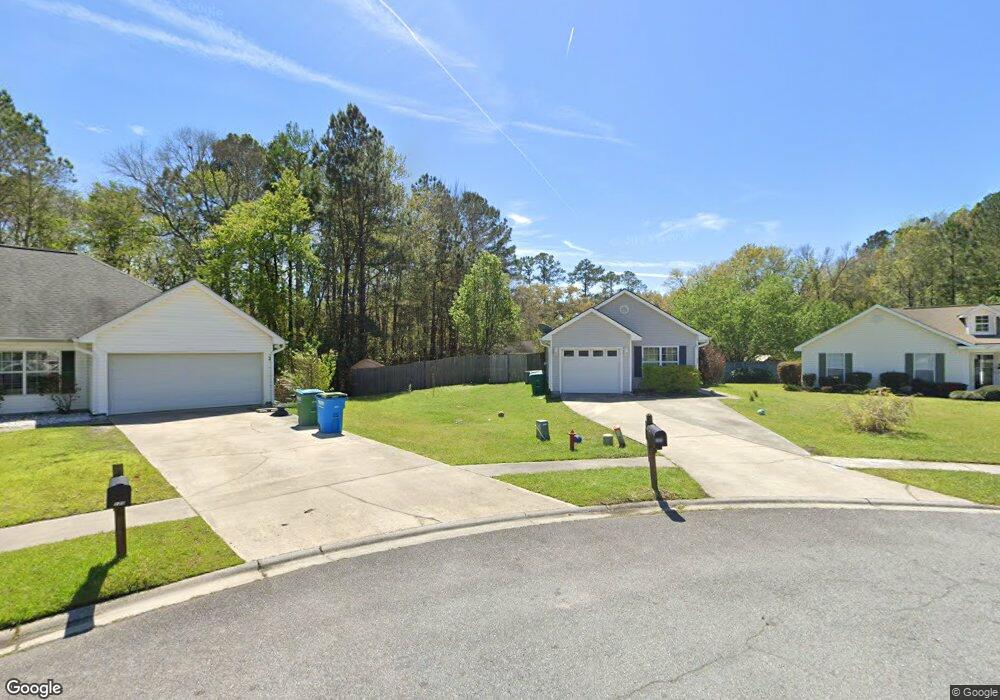
125 Four Oaks Ct Unit 13 Rincon, GA 31326
Estimated Value: $257,898 - $263,000
3
Beds
2
Baths
1,152
Sq Ft
$227/Sq Ft
Est. Value
About This Home
This home is located at 125 Four Oaks Ct Unit 13, Rincon, GA 31326 and is currently estimated at $260,975, approximately $226 per square foot. 125 Four Oaks Ct Unit 13 is a home located in Effingham County with nearby schools including Rincon Elementary School, Ebenezer Middle School, and Effingham County High School.
Ownership History
Date
Name
Owned For
Owner Type
Purchase Details
Closed on
May 26, 2016
Sold by
Cahill Francis X
Bought by
Nettles Joseph
Current Estimated Value
Home Financials for this Owner
Home Financials are based on the most recent Mortgage that was taken out on this home.
Original Mortgage
$107,255
Outstanding Balance
$85,613
Interest Rate
3.66%
Mortgage Type
New Conventional
Estimated Equity
$175,362
Purchase Details
Closed on
May 23, 2016
Sold by
Page Frances K
Bought by
Cahill Francis X
Home Financials for this Owner
Home Financials are based on the most recent Mortgage that was taken out on this home.
Original Mortgage
$107,255
Outstanding Balance
$85,613
Interest Rate
3.66%
Mortgage Type
New Conventional
Estimated Equity
$175,362
Purchase Details
Closed on
May 16, 2016
Sold by
House Harley E
Bought by
Cahill Francis X
Home Financials for this Owner
Home Financials are based on the most recent Mortgage that was taken out on this home.
Original Mortgage
$107,255
Outstanding Balance
$85,613
Interest Rate
3.66%
Mortgage Type
New Conventional
Estimated Equity
$175,362
Purchase Details
Closed on
Aug 8, 2000
Bought by
Cahill Francis X
Create a Home Valuation Report for This Property
The Home Valuation Report is an in-depth analysis detailing your home's value as well as a comparison with similar homes in the area
Home Values in the Area
Average Home Value in this Area
Purchase History
| Date | Buyer | Sale Price | Title Company |
|---|---|---|---|
| Nettles Joseph | $112,900 | -- | |
| Cahill Francis X | -- | -- | |
| Cahill Francis X | -- | -- | |
| Cahill Francis X | $92,300 | -- |
Source: Public Records
Mortgage History
| Date | Status | Borrower | Loan Amount |
|---|---|---|---|
| Open | Nettles Joseph | $107,255 |
Source: Public Records
Tax History Compared to Growth
Tax History
| Year | Tax Paid | Tax Assessment Tax Assessment Total Assessment is a certain percentage of the fair market value that is determined by local assessors to be the total taxable value of land and additions on the property. | Land | Improvement |
|---|---|---|---|---|
| 2024 | $1,174 | $91,183 | $22,800 | $68,383 |
| 2023 | $644 | $70,210 | $17,600 | $52,610 |
| 2022 | $1,132 | $60,454 | $17,600 | $42,854 |
| 2021 | $1,115 | $54,660 | $14,000 | $40,660 |
| 2020 | $1,212 | $50,984 | $12,000 | $38,984 |
| 2019 | $1,193 | $47,928 | $12,000 | $35,928 |
| 2018 | $1,130 | $44,848 | $10,000 | $34,848 |
| 2017 | $1,106 | $41,747 | $10,000 | $31,747 |
| 2016 | $806 | $41,946 | $12,800 | $29,146 |
| 2015 | -- | $36,346 | $7,200 | $29,146 |
| 2014 | -- | $34,546 | $5,400 | $29,146 |
| 2013 | -- | $34,318 | $6,400 | $27,918 |
Source: Public Records
Map
Nearby Homes
- 1219 Carolina Cove
- 310 Madison Oaks Dr
- 402 Madison Oaks Dr
- 718 N Columbia Ave
- 2 Talmadge Dr Unit B
- 2 Talmadge Dr
- 5B Sanders St
- 801 Lexington Ave
- 109 Danielle Loop
- 134 Crossing Cir
- 535 Plantation Dr
- 0 Fairmont Dr
- 510 & 512 Greenbay
- 513 E Williams St
- 0 E Fifth St Unit 10605519
- 0 E Fifth St Unit SA339176
- 121 Watson Dr
- 108 Crossing Cir
- 142 Cambridge Dr
- 125 Crossing Cir
- 125 Four Oaks Ct
- 123 Four Oaks Ct
- 127 Four Oaks Ct
- 1402 Exley Dr
- 121 Four Oaks Ct
- 1400 Exley Dr
- 112 Four Oaks Ct
- 1404 Exley Dr
- 101 Madison Oaks Dr
- 1380 Exley Dr
- 114 Four Oaks Ct
- 119 Four Oaks Ct
- 103 Madison Oaks Dr
- 1406 Exley Dr
- 116 Four Oaks Ct
- 1209 Exley Dr
- 105 Madison Oaks Dr
- 1213 Exley Dr
- 98 Madison Oaks Dr
- 118 Four Oaks Ct