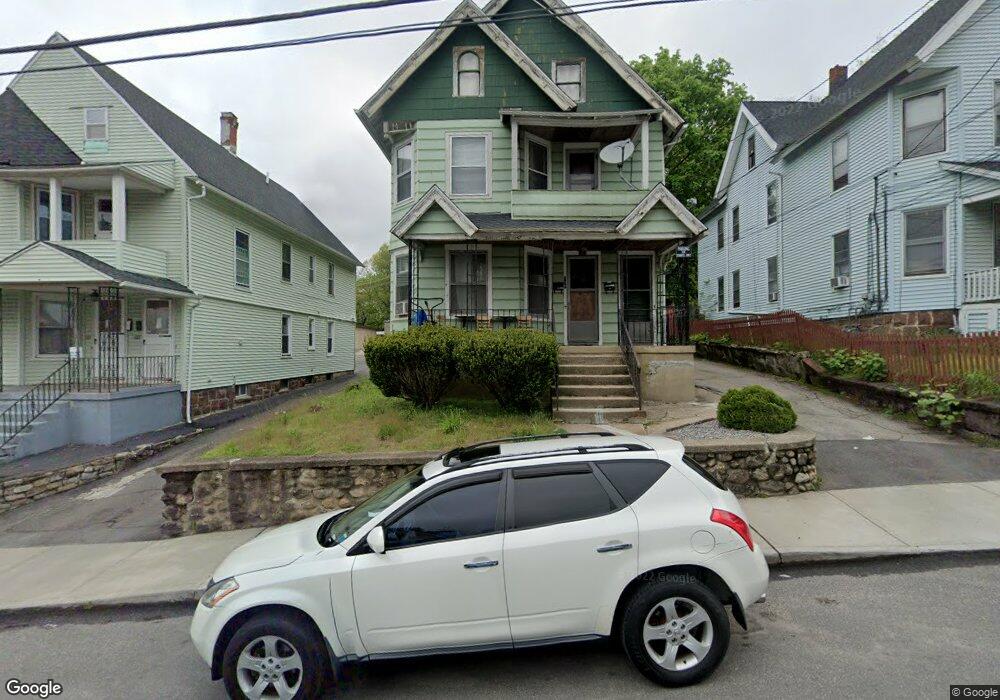
125 Griggs St Waterbury, CT 06704
North End District NeighborhoodEstimated Value: $262,845 - $322,000
4
Beds
2
Baths
2,496
Sq Ft
$121/Sq Ft
Est. Value
About This Home
This home is located at 125 Griggs St, Waterbury, CT 06704 and is currently estimated at $302,711, approximately $121 per square foot. 125 Griggs St is a home located in New Haven County with nearby schools including Wilby High School and Alpha & Omega Christian Academy.
Ownership History
Date
Name
Owned For
Owner Type
Purchase Details
Closed on
Feb 28, 2006
Sold by
Calabro Frank and Calabro Anne M
Bought by
Diaz Eladio A and Diaz Yaniris C
Current Estimated Value
Home Financials for this Owner
Home Financials are based on the most recent Mortgage that was taken out on this home.
Original Mortgage
$135,900
Outstanding Balance
$76,805
Interest Rate
6.17%
Mortgage Type
Purchase Money Mortgage
Estimated Equity
$225,906
Create a Home Valuation Report for This Property
The Home Valuation Report is an in-depth analysis detailing your home's value as well as a comparison with similar homes in the area
Home Values in the Area
Average Home Value in this Area
Purchase History
| Date | Buyer | Sale Price | Title Company |
|---|---|---|---|
| Diaz Eladio A | $169,900 | -- |
Source: Public Records
Mortgage History
| Date | Status | Borrower | Loan Amount |
|---|---|---|---|
| Open | Diaz Eladio A | $135,900 | |
| Closed | Diaz Eladio A | $33,950 |
Source: Public Records
Tax History Compared to Growth
Tax History
| Year | Tax Paid | Tax Assessment Tax Assessment Total Assessment is a certain percentage of the fair market value that is determined by local assessors to be the total taxable value of land and additions on the property. | Land | Improvement |
|---|---|---|---|---|
| 2025 | $4,295 | $95,480 | $11,970 | $83,510 |
| 2024 | $4,721 | $95,480 | $11,970 | $83,510 |
| 2023 | $5,174 | $95,480 | $11,970 | $83,510 |
| 2022 | $2,411 | $40,050 | $11,970 | $28,080 |
| 2021 | $2,411 | $40,050 | $11,970 | $28,080 |
| 2020 | $2,411 | $40,050 | $11,970 | $28,080 |
| 2019 | $2,411 | $40,050 | $11,970 | $28,080 |
| 2018 | $2,411 | $40,050 | $11,970 | $28,080 |
| 2017 | $2,341 | $38,880 | $11,970 | $26,910 |
| 2016 | $2,341 | $38,880 | $11,970 | $26,910 |
| 2015 | $2,264 | $38,880 | $11,970 | $26,910 |
| 2014 | $2,264 | $38,880 | $11,970 | $26,910 |
Source: Public Records
Map
Nearby Homes