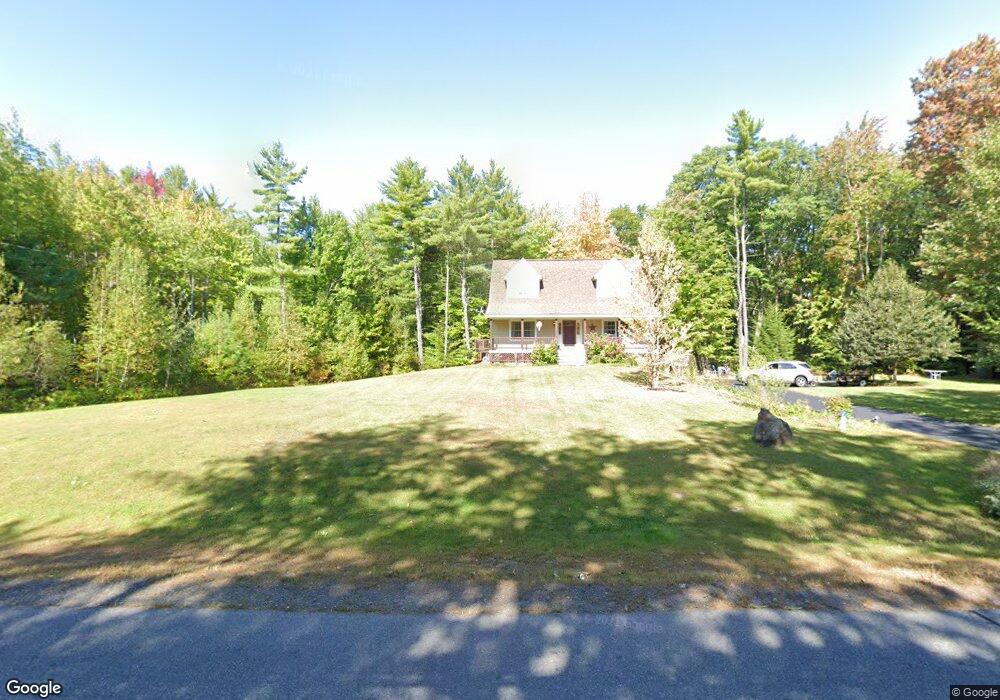
125 Guinea Rd Berwick, ME 03901
Estimated Value: $422,000 - $552,000
3
Beds
3
Baths
1,862
Sq Ft
$275/Sq Ft
Est. Value
About This Home
This home is located at 125 Guinea Rd, Berwick, ME 03901 and is currently estimated at $511,954, approximately $274 per square foot. 125 Guinea Rd is a home located in York County with nearby schools including Noble High School, Berwick Academy, and Seacoast Christian School.
Ownership History
Date
Name
Owned For
Owner Type
Purchase Details
Closed on
Apr 3, 2008
Sold by
Mccormack Steven F
Bought by
Mccormack Steven E
Current Estimated Value
Purchase Details
Closed on
Sep 6, 2005
Sold by
Mccormack Steven E and Mccormack Herchel
Bought by
Mccormack Steven F and Mccormack Steven E
Home Financials for this Owner
Home Financials are based on the most recent Mortgage that was taken out on this home.
Original Mortgage
$266,000
Interest Rate
5.81%
Mortgage Type
Purchase Money Mortgage
Create a Home Valuation Report for This Property
The Home Valuation Report is an in-depth analysis detailing your home's value as well as a comparison with similar homes in the area
Home Values in the Area
Average Home Value in this Area
Purchase History
| Date | Buyer | Sale Price | Title Company |
|---|---|---|---|
| Mccormack Steven E | -- | -- | |
| Mccormack Steven F | -- | -- |
Source: Public Records
Mortgage History
| Date | Status | Borrower | Loan Amount |
|---|---|---|---|
| Previous Owner | Mccormack Steven F | $266,000 |
Source: Public Records
Tax History
| Year | Tax Paid | Tax Assessment Tax Assessment Total Assessment is a certain percentage of the fair market value that is determined by local assessors to be the total taxable value of land and additions on the property. | Land | Improvement |
|---|---|---|---|---|
| 2025 | $6,047 | $463,700 | $108,500 | $355,200 |
| 2024 | $5,782 | $463,700 | $108,500 | $355,200 |
| 2023 | $5,437 | $296,800 | $76,800 | $220,000 |
| 2022 | $5,408 | $296,800 | $76,800 | $220,000 |
| 2021 | $5,431 | $296,800 | $76,800 | $220,000 |
| 2020 | $5,746 | $296,800 | $76,800 | $220,000 |
| 2019 | $5,203 | $296,800 | $76,800 | $220,000 |
| 2018 | $5,067 | $287,900 | $73,300 | $214,600 |
| 2017 | $4,937 | $287,900 | $73,300 | $214,600 |
| 2016 | $4,693 | $287,900 | $73,300 | $214,600 |
| 2014 | $4,578 | $287,900 | $73,300 | $214,600 |
| 2013 | $4,621 | $287,900 | $73,300 | $214,600 |
Source: Public Records
Map
Nearby Homes
- 378 School St
- 6 Lilac Ln
- 13 Diamond Hill Rd
- 3 Heritage Dr
- 2 Heritage Dr
- 6 Heritage Dr
- 32 Heritage Dr
- TBD Buffum Rd
- 32 Camden Rd
- 6 Friendship Ct
- 3 Legend Trail
- 46 Old Pine Hill Rd S
- 13 Haflinger Ln
- 12 Puffin Ln
- 101 School St
- 148 Sullivan St
- 55 Fox Ridge Dr
- 24 Spillanes Hill
- 14 Berwick Rd
- 53 Saw Mill Hill
Your Personal Tour Guide
Ask me questions while you tour the home.