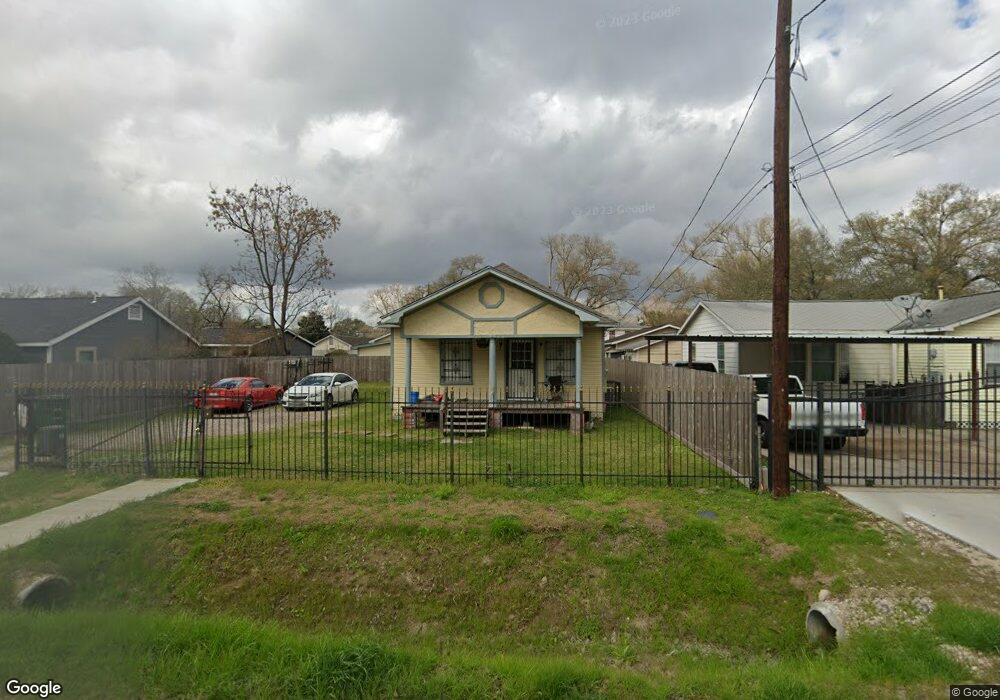
125 Harkness St Houston, TX 77076
Northside-Northline NeighborhoodEstimated Value: $176,000 - $268,000
3
Beds
2
Baths
1,854
Sq Ft
$119/Sq Ft
Est. Value
About This Home
This home is located at 125 Harkness St, Houston, TX 77076 and is currently estimated at $220,119, approximately $118 per square foot. 125 Harkness St is a home located in Harris County with nearby schools including Lyons Elementary School, Fonville Middle School, and Sam Houston Math, Science & Technology Center.
Ownership History
Date
Name
Owned For
Owner Type
Purchase Details
Closed on
Mar 7, 2016
Sold by
Batres Lester and Batres Elia
Bought by
Lozano Felipe A and Lozano Elia
Current Estimated Value
Home Financials for this Owner
Home Financials are based on the most recent Mortgage that was taken out on this home.
Original Mortgage
$103,785
Outstanding Balance
$82,741
Interest Rate
3.87%
Mortgage Type
FHA
Estimated Equity
$137,378
Purchase Details
Closed on
Nov 20, 2015
Sold by
Batres Bolivar and Batres Juana
Bought by
Batres Lester and Batres Elia
Purchase Details
Closed on
Dec 18, 2009
Sold by
Loera Pedro and Loera Maria Alfaro
Bought by
Batres Bolivar
Purchase Details
Closed on
Dec 10, 2008
Sold by
Loera Genaro
Bought by
Loera Pedro and Loera Maria Alfaro
Purchase Details
Closed on
Mar 10, 2007
Sold by
Garcia Isidonio and Garcia Maria
Bought by
Loera Maria and Loera Genaro
Create a Home Valuation Report for This Property
The Home Valuation Report is an in-depth analysis detailing your home's value as well as a comparison with similar homes in the area
Home Values in the Area
Average Home Value in this Area
Purchase History
| Date | Buyer | Sale Price | Title Company |
|---|---|---|---|
| Lozano Felipe A | -- | None Available | |
| Batres Lester | -- | Attorney | |
| Batres Bolivar | -- | Stewart Title Houston Div | |
| Loera Pedro | -- | None Available | |
| Loera Maria | -- | American Title Co |
Source: Public Records
Mortgage History
| Date | Status | Borrower | Loan Amount |
|---|---|---|---|
| Open | Lozano Felipe A | $103,785 |
Source: Public Records
Tax History Compared to Growth
Tax History
| Year | Tax Paid | Tax Assessment Tax Assessment Total Assessment is a certain percentage of the fair market value that is determined by local assessors to be the total taxable value of land and additions on the property. | Land | Improvement |
|---|---|---|---|---|
| 2025 | $4,792 | $223,385 | $98,013 | $125,372 |
| 2024 | $4,792 | $229,027 | $98,013 | $131,014 |
| 2023 | $4,792 | $230,785 | $94,851 | $135,934 |
| 2022 | $4,063 | $184,512 | $73,773 | $110,739 |
| 2021 | $3,325 | $142,680 | $38,643 | $104,037 |
| 2020 | $3,245 | $134,018 | $38,643 | $95,375 |
| 2019 | $3,362 | $132,861 | $38,643 | $94,218 |
| 2018 | $2,465 | $97,402 | $28,104 | $69,298 |
| 2017 | $2,463 | $97,402 | $28,104 | $69,298 |
| 2016 | $2,327 | $92,037 | $28,104 | $63,933 |
| 2015 | $2,297 | $89,337 | $28,104 | $61,233 |
| 2014 | $2,297 | $89,337 | $28,104 | $61,233 |
Source: Public Records
Map
Nearby Homes
- 10202 Fulton St
- 10135 Fulton St
- 10210 Fulton St
- 10041 Fulton St
- 10245 O Donnell Dr
- 9910 Fulton St
- 153 Treasure Dr
- 9905 Fulton St
- 9925 Dipping Woods St
- 207 Dipping Stream St
- 9902 Clark Rd Unit D
- 9902 Clark Rd Unit I
- 9902 Clark Rd Unit G
- 64 Dipping Ln
- 9215 Plan at Fulton Crossing
- 9289 Plan at Fulton Crossing
- 9293 Plan at Fulton Crossing
- 9236 Plan at Fulton Crossing
- 9913 Dipping Woods St
- 9816 Fulton St
- 123 Harkness St
- 131 Harkness St
- 121 Harkness St
- 137 Harkness St
- 139 Harkness St Unit 770
- 122 Tallant St
- 122 Harkness St
- 118 Tallant St
- 126 Tallant St
- 134 Harkness St
- 118 Harkness St
- 112 Tallant St
- 136 Harkness St
- 114 Harkness St
- 101 Harkness St
- 130 Tallant St
- 141 Harkness St
- 110 Tallant St
- 110 Harkness St
- 155 Harkness St