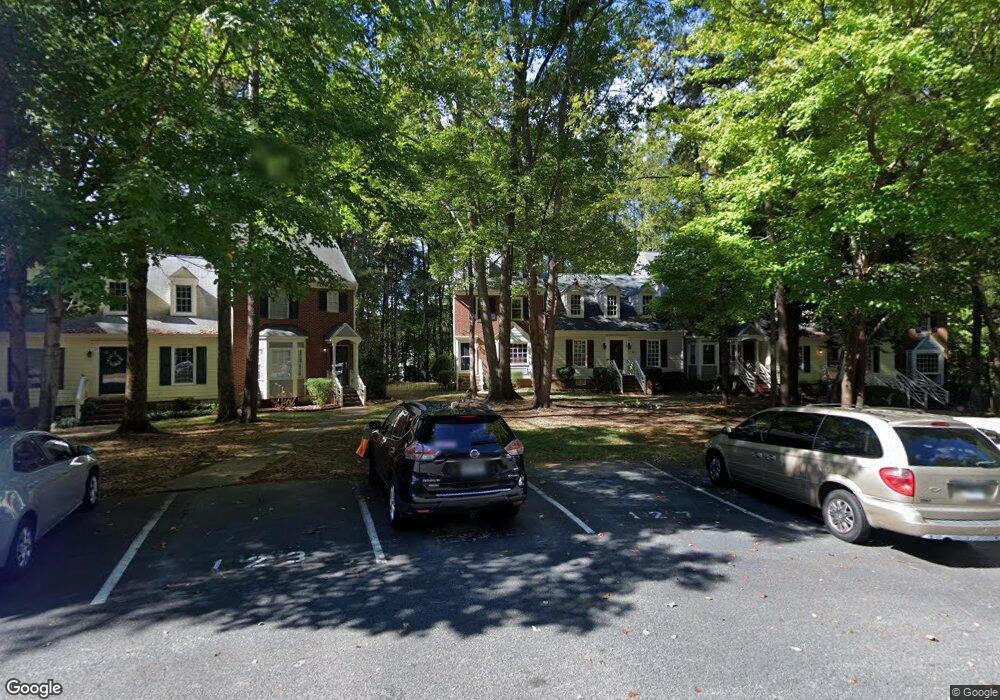
125 Hedgerow Ct Cary, NC 27513
South Cary NeighborhoodEstimated Value: $324,000 - $333,579
2
Beds
3
Baths
1,310
Sq Ft
$250/Sq Ft
Est. Value
About This Home
This home is located at 125 Hedgerow Ct, Cary, NC 27513 and is currently estimated at $327,395, approximately $249 per square foot. 125 Hedgerow Ct is a home located in Wake County with nearby schools including Weatherstone Elementary School, East Cary Middle School, and Cary High School.
Ownership History
Date
Name
Owned For
Owner Type
Purchase Details
Closed on
Aug 27, 2008
Sold by
Green Shirley L
Bought by
Green Trust
Current Estimated Value
Purchase Details
Closed on
Nov 30, 2007
Sold by
Murray Sharon A and Pettigrew Roy Gregory
Bought by
Green Shirley L
Home Financials for this Owner
Home Financials are based on the most recent Mortgage that was taken out on this home.
Original Mortgage
$100,000
Interest Rate
6.36%
Mortgage Type
Unknown
Purchase Details
Closed on
Dec 13, 2001
Sold by
Nielsen Karl E and Nielsen Stephanie M
Bought by
Murray Sharon A
Home Financials for this Owner
Home Financials are based on the most recent Mortgage that was taken out on this home.
Original Mortgage
$95,520
Interest Rate
6.5%
Purchase Details
Closed on
Dec 16, 1999
Sold by
Wehner Susen
Bought by
Nielsen Karl E and Nielsen Stephanie M
Home Financials for this Owner
Home Financials are based on the most recent Mortgage that was taken out on this home.
Original Mortgage
$97,700
Interest Rate
7.12%
Create a Home Valuation Report for This Property
The Home Valuation Report is an in-depth analysis detailing your home's value as well as a comparison with similar homes in the area
Home Values in the Area
Average Home Value in this Area
Purchase History
| Date | Buyer | Sale Price | Title Company |
|---|---|---|---|
| Green Trust | -- | None Available | |
| Green Shirley L | $138,000 | None Available | |
| Murray Sharon A | $119,500 | -- | |
| Nielsen Karl E | $116,000 | -- |
Source: Public Records
Mortgage History
| Date | Status | Borrower | Loan Amount |
|---|---|---|---|
| Previous Owner | Green Shirley L | $100,000 | |
| Previous Owner | Murray Sharon A | $95,520 | |
| Previous Owner | Nielsen Karl E | $97,700 |
Source: Public Records
Tax History
| Year | Tax Paid | Tax Assessment Tax Assessment Total Assessment is a certain percentage of the fair market value that is determined by local assessors to be the total taxable value of land and additions on the property. | Land | Improvement |
|---|---|---|---|---|
| 2025 | -- | $337,125 | $115,000 | $222,125 |
| 2024 | $2,847 | $337,125 | $115,000 | $222,125 |
| 2023 | $1,996 | $197,210 | $50,000 | $147,210 |
| 2022 | $1,922 | $197,210 | $50,000 | $147,210 |
| 2021 | $1,884 | $197,210 | $50,000 | $147,210 |
| 2020 | $1,894 | $197,210 | $50,000 | $147,210 |
| 2019 | $1,652 | $152,453 | $30,000 | $122,453 |
| 2018 | $1,551 | $152,453 | $30,000 | $122,453 |
| 2017 | $1,491 | $152,453 | $30,000 | $122,453 |
| 2016 | $1,469 | $152,453 | $30,000 | $122,453 |
| 2015 | $1,545 | $154,947 | $32,000 | $122,947 |
| 2014 | $1,458 | $154,947 | $32,000 | $122,947 |
Source: Public Records
Map
Nearby Homes
- 143 Hedgerow Ct
- 101 Hedgerow Ct
- 136 Orchard Park Dr
- 102 Joel Ct
- 104 Bayoak Dr
- 209 High House Rd
- 207 High House Rd
- 117 Red Bud Ct
- 723 Springfork Dr Unit 422
- 631 Springfork Dr Unit 5C3
- 136 Lake Hollow Cir
- 1115 Contessa Dr
- 132 Edgehill Pkwy
- 316 Howland Ave
- 522 Weather Ridge Ln
- 512 Weather Ridge Ln Unit 2
- 509 Matheson Place
- 607 Weather Ridge Ln Unit 24
- 611 Weather Ridge Ln Unit 25
- 618 Weather Ridge Ln Unit 28
- 127 Hedgerow Ct
- 123 Hedgerow Ct
- 129 Hedgerow Ct
- 121 Hedgerow Ct
- 131 Hedgerow Ct
- 119 Hedgerow Ct
- 133 Hedgerow Ct
- 117 Hedgerow Ct
- 310 Orchard Park Dr
- 308 Orchard Park Dr
- 306 Orchard Park Dr
- 304 Orchard Park Dr
- 302 Orchard Park Dr
- 135 Hedgerow Ct
- 300 Orchard Park Dr
- 300 Orchard Park Dr Unit 310
- 137 Hedgerow Ct
- 115 Hedgerow Ct
- 139 Hedgerow Ct
- 113 Hedgerow Ct
Your Personal Tour Guide
Ask me questions while you tour the home.