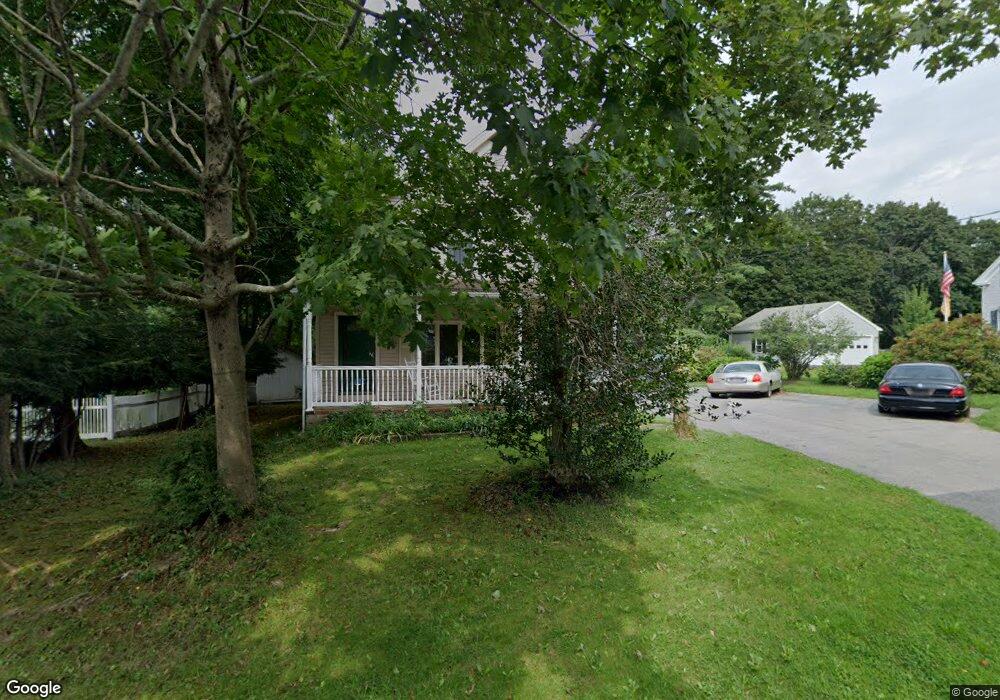
125 High St Hanson, MA 02341
Estimated Value: $412,000 - $508,000
3
Beds
2
Baths
1,318
Sq Ft
$350/Sq Ft
Est. Value
About This Home
This home is located at 125 High St, Hanson, MA 02341 and is currently estimated at $461,877, approximately $350 per square foot. 125 High St is a home located in Plymouth County.
Ownership History
Date
Name
Owned For
Owner Type
Purchase Details
Closed on
Dec 4, 2006
Sold by
Pennini Linda R
Bought by
Pennini Linda R and Pennini Robert
Current Estimated Value
Home Financials for this Owner
Home Financials are based on the most recent Mortgage that was taken out on this home.
Original Mortgage
$129,000
Interest Rate
6.36%
Mortgage Type
Purchase Money Mortgage
Create a Home Valuation Report for This Property
The Home Valuation Report is an in-depth analysis detailing your home's value as well as a comparison with similar homes in the area
Home Values in the Area
Average Home Value in this Area
Purchase History
| Date | Buyer | Sale Price | Title Company |
|---|---|---|---|
| Pennini Linda R | -- | -- |
Source: Public Records
Mortgage History
| Date | Status | Borrower | Loan Amount |
|---|---|---|---|
| Open | Pennini Linda R | $25,000 | |
| Open | Pennini Linda R | $150,000 | |
| Closed | Pennini Linda R | $129,000 | |
| Previous Owner | Pennini Linda R | $50,000 |
Source: Public Records
Tax History
| Year | Tax Paid | Tax Assessment Tax Assessment Total Assessment is a certain percentage of the fair market value that is determined by local assessors to be the total taxable value of land and additions on the property. | Land | Improvement |
|---|---|---|---|---|
| 2025 | $4,350 | $325,100 | $184,000 | $141,100 |
| 2024 | $4,272 | $319,300 | $178,700 | $140,600 |
| 2023 | $4,316 | $304,400 | $178,700 | $125,700 |
| 2022 | $4,221 | $279,700 | $162,400 | $117,300 |
| 2021 | $361,744 | $254,900 | $156,200 | $98,700 |
| 2020 | $5,778 | $240,900 | $150,900 | $90,000 |
| 2019 | $3,601 | $231,900 | $148,000 | $83,900 |
| 2018 | $3,560 | $224,900 | $142,300 | $82,600 |
| 2017 | $3,452 | $216,000 | $135,500 | $80,500 |
| 2016 | $3,545 | $214,200 | $135,500 | $78,700 |
| 2015 | $3,389 | $212,900 | $135,500 | $77,400 |
Source: Public Records
Map
Nearby Homes
- 72 Phillips St
- 80 Phillips St
- 1054 Main St
- Lot 6 Way
- Lot 2 Harvard Rd
- 361A County Rd
- 361 County Rd
- 170 Elm St
- 61 Sawmill Ln
- 61 Sawmill Ln Unit 61
- 26 Franklin St
- 318 South St
- 161 Winter St Unit 11
- 1754 Central St
- 126-130 Franklin St
- 134 Crescent St
- 84 Liberty St
- 143 Plymouth St
- Lot 5 Princeton Way
- 23 Bell Dr
Your Personal Tour Guide
Ask me questions while you tour the home.