Estimated Value: $94,000 - $137,000
1
Bed
1
Bath
1,073
Sq Ft
$109/Sq Ft
Est. Value
About This Home
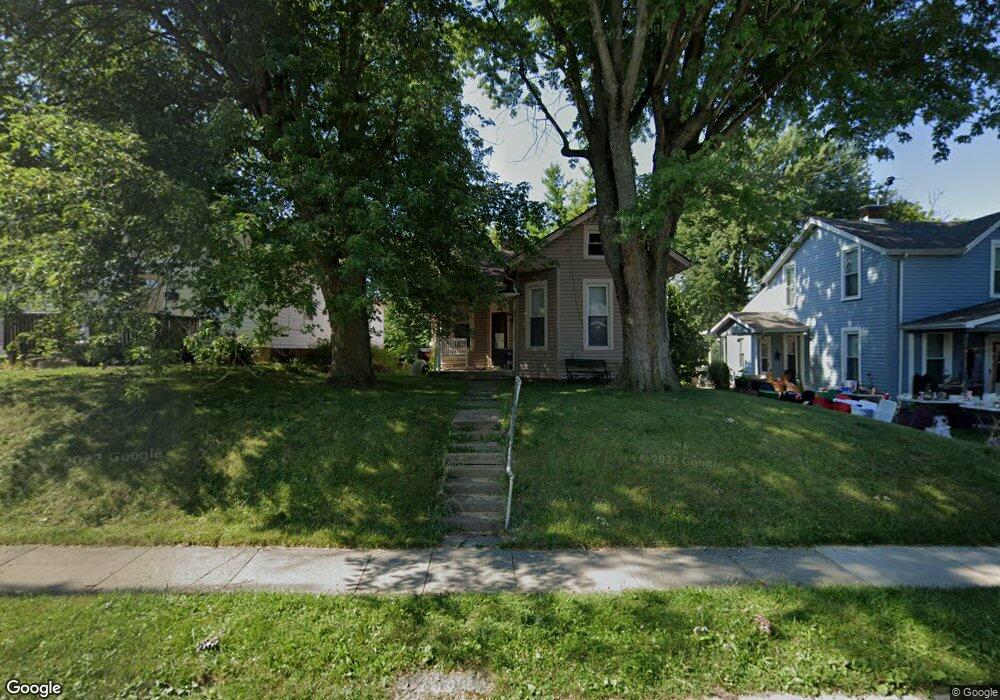
This home is located at 125 High St, Xenia, OH 45385 and is currently estimated at $116,750, approximately $108 per square foot. 125 High St is a home located in Greene County with nearby schools including Xenia High School, Summit Academy Community School for Alternative Learners - Xenia, and Legacy Christian Academy.
Ownership History
Date
Name
Owned For
Owner Type
Purchase Details
Closed on
Jan 11, 2012
Sold by
Johnson Karlene M and Johnson Gilbert L
Bought by
Johnson Erik J
Current Estimated Value
Purchase Details
Closed on
Jun 28, 2010
Sold by
The Secretary Of Veterans Affairs
Bought by
Johnson Karlene
Purchase Details
Closed on
Mar 24, 2010
Sold by
Liming Donna L
Bought by
Secretary Of Veterans Affairs
Purchase Details
Closed on
Nov 6, 1995
Sold by
Howard David G
Bought by
Liming Frank R and Liming L
Home Financials for this Owner
Home Financials are based on the most recent Mortgage that was taken out on this home.
Original Mortgage
$54,487
Interest Rate
9%
Mortgage Type
VA
Create a Home Valuation Report for This Property
The Home Valuation Report is an in-depth analysis detailing your home's value as well as a comparison with similar homes in the area
Home Values in the Area
Average Home Value in this Area
Purchase History
| Date | Buyer | Sale Price | Title Company |
|---|---|---|---|
| Johnson Erik J | -- | Attorney | |
| Johnson Karlene | $26,000 | New Millennium Title | |
| Secretary Of Veterans Affairs | $40,000 | None Available | |
| Liming Frank R | $52,900 | -- |
Source: Public Records
Mortgage History
| Date | Status | Borrower | Loan Amount |
|---|---|---|---|
| Previous Owner | Liming Frank R | $54,487 |
Source: Public Records
Tax History Compared to Growth
Tax History
| Year | Tax Paid | Tax Assessment Tax Assessment Total Assessment is a certain percentage of the fair market value that is determined by local assessors to be the total taxable value of land and additions on the property. | Land | Improvement |
|---|---|---|---|---|
| 2024 | $525 | $22,370 | $4,490 | $17,880 |
| 2023 | $525 | $22,370 | $4,490 | $17,880 |
| 2022 | $409 | $17,090 | $3,600 | $13,490 |
| 2021 | $415 | $17,090 | $3,600 | $13,490 |
| 2020 | $374 | $17,090 | $3,600 | $13,490 |
| 2019 | $374 | $16,170 | $3,230 | $12,940 |
| 2018 | $376 | $16,170 | $3,230 | $12,940 |
| 2017 | $396 | $16,170 | $3,230 | $12,940 |
| 2016 | $981 | $18,540 | $3,230 | $15,310 |
| 2015 | $1,788 | $18,540 | $3,230 | $15,310 |
| 2014 | $1,195 | $18,540 | $3,230 | $15,310 |
Source: Public Records
Map
Nearby Homes