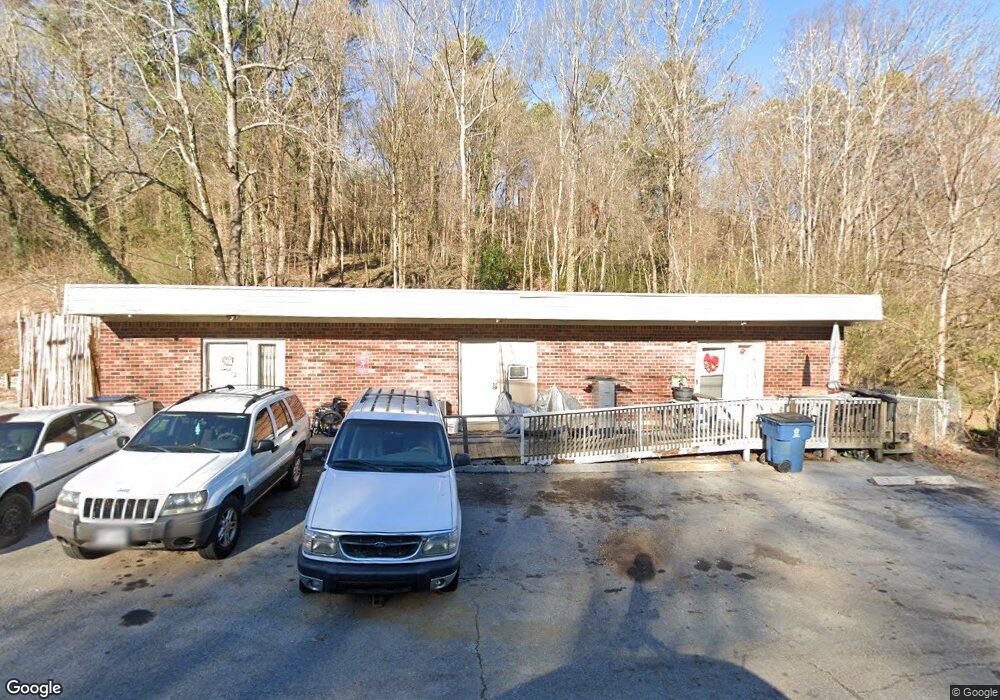
125 Hogan Rd Rossville, GA 30741
Estimated Value: $171,024 - $342,000
--
Bed
3
Baths
780
Sq Ft
$313/Sq Ft
Est. Value
About This Home
This home is located at 125 Hogan Rd, Rossville, GA 30741 and is currently estimated at $243,756, approximately $312 per square foot. 125 Hogan Rd is a home located in Walker County with nearby schools including Rossville Elementary School, Rossville Middle School, and Ridgeland High School.
Ownership History
Date
Name
Owned For
Owner Type
Purchase Details
Closed on
Jan 12, 2024
Sold by
Rogers Una
Bought by
Rogers Una and Free Sebrina
Current Estimated Value
Purchase Details
Closed on
Nov 17, 2010
Sold by
Rogers Virginia Jo
Bought by
Rogers Charles
Purchase Details
Closed on
Nov 11, 2010
Sold by
Rogers Virginia Jo
Bought by
Rogers Charles
Purchase Details
Closed on
Sep 9, 1987
Sold by
Rogers Charles Ed
Bought by
Rogers Virginia Jo
Purchase Details
Closed on
Jul 24, 1980
Sold by
Farmer Mary R
Bought by
Rogers Charles Ed
Purchase Details
Closed on
Feb 3, 1978
Sold by
Mcdaniel Kenneth
Bought by
Farmer Mary R
Purchase Details
Closed on
Jul 12, 1973
Sold by
Johnson James G
Bought by
Mcdaniel Kenneth
Purchase Details
Closed on
Jan 24, 1973
Sold by
Ramsey Benard and Ramsey Dorothy
Bought by
Johnson James G
Purchase Details
Closed on
Sep 7, 1971
Bought by
Ramsey Benard and Ramsey Dorothy
Create a Home Valuation Report for This Property
The Home Valuation Report is an in-depth analysis detailing your home's value as well as a comparison with similar homes in the area
Home Values in the Area
Average Home Value in this Area
Purchase History
| Date | Buyer | Sale Price | Title Company |
|---|---|---|---|
| Rogers Una | -- | -- | |
| Rogers Charles | $2,000 | -- | |
| Rogers Charles | $2,000 | -- | |
| Rogers Virginia Jo | -- | -- | |
| Rogers Charles Ed | -- | -- | |
| Farmer Mary R | -- | -- | |
| Mcdaniel Kenneth | -- | -- | |
| Johnson James G | -- | -- | |
| Ramsey Benard | -- | -- |
Source: Public Records
Tax History Compared to Growth
Tax History
| Year | Tax Paid | Tax Assessment Tax Assessment Total Assessment is a certain percentage of the fair market value that is determined by local assessors to be the total taxable value of land and additions on the property. | Land | Improvement |
|---|---|---|---|---|
| 2024 | $461 | $43,292 | $6,270 | $37,022 |
| 2023 | $439 | $41,305 | $6,270 | $35,035 |
| 2022 | $1,281 | $34,359 | $4,702 | $29,657 |
| 2021 | $593 | $27,749 | $4,702 | $23,047 |
| 2020 | $505 | $23,864 | $4,702 | $19,162 |
| 2019 | $505 | $23,864 | $4,702 | $19,162 |
| 2018 | $710 | $23,864 | $4,702 | $19,162 |
| 2017 | $575 | $23,864 | $4,702 | $19,162 |
| 2016 | $470 | $23,864 | $4,702 | $19,162 |
| 2015 | $465 | $22,892 | $5,040 | $17,852 |
| 2014 | $638 | $22,892 | $5,040 | $17,852 |
| 2013 | -- | $22,892 | $5,040 | $17,852 |
Source: Public Records
Map
Nearby Homes
- 0 S Mission Ridge Dr Unit 1504695
- 71 Georgia Terrace
- 127 Summitt St
- 0 Summit St Unit 1514634
- 39 Clift Trail
- 0 Dempsey Ln Unit 1504691
- 301 Dempsey Ln
- 189 Leinbach Rd
- 405 Andrews St
- 601 Chickamauga Ave
- 3 Fox Chase St
- 404 E Gordon Ave
- 1 Fox Chase St
- 0 W Crest Rd Unit 1514944
- 302 E Gordon Ave
- 107 Lakeview Dr
- 702 Short St
- 115 Beech St
- 220 W Crest Rd
- 3312 E 51st St
- 125 Hogan Rd Unit 1
- 123 Hogan Rd
- 129 Hogan Rd
- 124 Hogan Rd
- 74 Georgia Terrace
- 121 Hogan Rd
- 131 Hogan Rd
- 120 Hogan Rd
- 126 Hogan Rd
- 152 Hogan Heights
- 102 Hogan Heights
- 133 Hogan Rd
- 128 Hogan Rd
- 119 Hogan Rd
- 118 Hogan Rd
- 135 Hogan Rd
- 67 Georgia Terrace
- 117 Hogan Rd
- 0 S Mission Ridge Dr Unit 1269027
- 0 S Mission Ridge Dr Unit RTC2729819