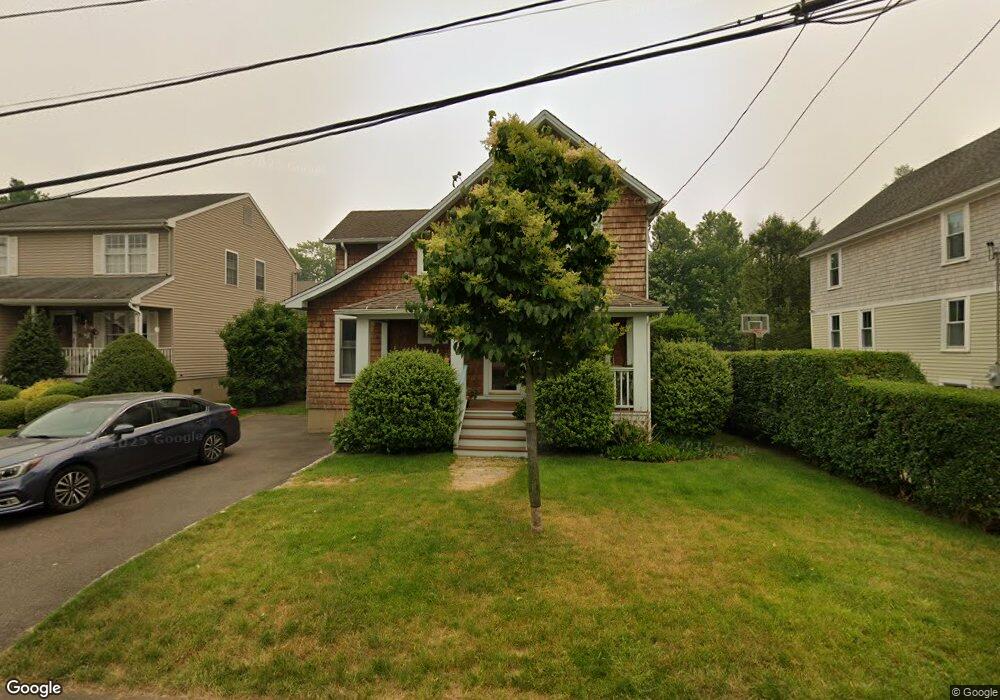
125 Howard St Fairfield, CT 06824
Fairfield Beach NeighborhoodEstimated Value: $823,000 - $1,020,000
3
Beds
3
Baths
1,578
Sq Ft
$610/Sq Ft
Est. Value
About This Home
This home is located at 125 Howard St, Fairfield, CT 06824 and is currently estimated at $963,224, approximately $610 per square foot. 125 Howard St is a home located in Fairfield County with nearby schools including Roger Sherman Elementary School, Roger Ludlowe Middle School, and Fairfield Ludlowe High School.
Ownership History
Date
Name
Owned For
Owner Type
Purchase Details
Closed on
Mar 4, 2005
Sold by
Pisani Carol J and Strolin Joseph G
Bought by
Strauss Robert S
Current Estimated Value
Home Financials for this Owner
Home Financials are based on the most recent Mortgage that was taken out on this home.
Original Mortgage
$100,000
Outstanding Balance
$51,604
Interest Rate
5.78%
Estimated Equity
$911,620
Purchase Details
Closed on
Apr 14, 2000
Sold by
Cheney Jason and Cheney Lenore
Bought by
Pisani Carol J and Strolin Joseph G
Purchase Details
Closed on
Jun 17, 1998
Sold by
Komanski Edward and Komanski Jeffrey
Bought by
Cheney Jason and Cheney Lenore
Purchase Details
Closed on
Aug 10, 1996
Sold by
Mosco Leonard
Bought by
Benway Bruce A
Purchase Details
Closed on
Feb 20, 1996
Sold by
Est Komanski Frances M and Komanski Edward
Bought by
Mosco Leonard
Create a Home Valuation Report for This Property
The Home Valuation Report is an in-depth analysis detailing your home's value as well as a comparison with similar homes in the area
Home Values in the Area
Average Home Value in this Area
Purchase History
| Date | Buyer | Sale Price | Title Company |
|---|---|---|---|
| Strauss Robert S | $535,000 | -- | |
| Strauss Robert S | $535,000 | -- | |
| Pisani Carol J | $318,500 | -- | |
| Pisani Carol J | $318,500 | -- | |
| Cheney Jason | $171,000 | -- | |
| Cheney Jason | $171,000 | -- | |
| Benway Bruce A | $115,000 | -- | |
| Benway Bruce A | $115,000 | -- | |
| Mosco Leonard | $92,000 | -- | |
| Mosco Leonard | $92,000 | -- |
Source: Public Records
Mortgage History
| Date | Status | Borrower | Loan Amount |
|---|---|---|---|
| Open | Mosco Leonard | $100,000 | |
| Previous Owner | Mosco Leonard | $294,500 |
Source: Public Records
Tax History
| Year | Tax Paid | Tax Assessment Tax Assessment Total Assessment is a certain percentage of the fair market value that is determined by local assessors to be the total taxable value of land and additions on the property. | Land | Improvement |
|---|---|---|---|---|
| 2025 | $10,499 | $369,810 | $299,390 | $70,420 |
| 2024 | $10,318 | $369,810 | $299,390 | $70,420 |
| 2023 | $10,173 | $369,810 | $299,390 | $70,420 |
| 2022 | $10,074 | $369,810 | $299,390 | $70,420 |
| 2021 | $9,977 | $369,810 | $299,390 | $70,420 |
| 2020 | $8,581 | $320,320 | $238,980 | $81,340 |
| 2019 | $8,581 | $320,320 | $238,980 | $81,340 |
| 2018 | $8,444 | $320,320 | $238,980 | $81,340 |
| 2017 | $8,271 | $320,320 | $238,980 | $81,340 |
| 2016 | $8,152 | $320,320 | $238,980 | $81,340 |
| 2015 | $8,014 | $323,260 | $251,370 | $71,890 |
| 2014 | $7,888 | $323,260 | $251,370 | $71,890 |
Source: Public Records
Map
Nearby Homes
- 110 Pratt St
- 88 Veres St
- 187 Catherine Terrace
- 110 Alden St
- 345 Reef Rd Unit B6
- 345 Reef Rd Unit C9
- 2 Mellow St
- 28 Michaela Cir
- 127 Paul Place
- 464 Ruane St
- 117 Forest Ave
- 783 Reef Rd
- 126 Lalley Blvd
- 378 Penfield Rd
- 394 Penfield Rd
- 65 Thorpe St Unit 65
- 25 Helen St
- 138 Granville St
- 1235 Fairfield Beach Rd
- 1053 Fairfield Beach Rd
Your Personal Tour Guide
Ask me questions while you tour the home.