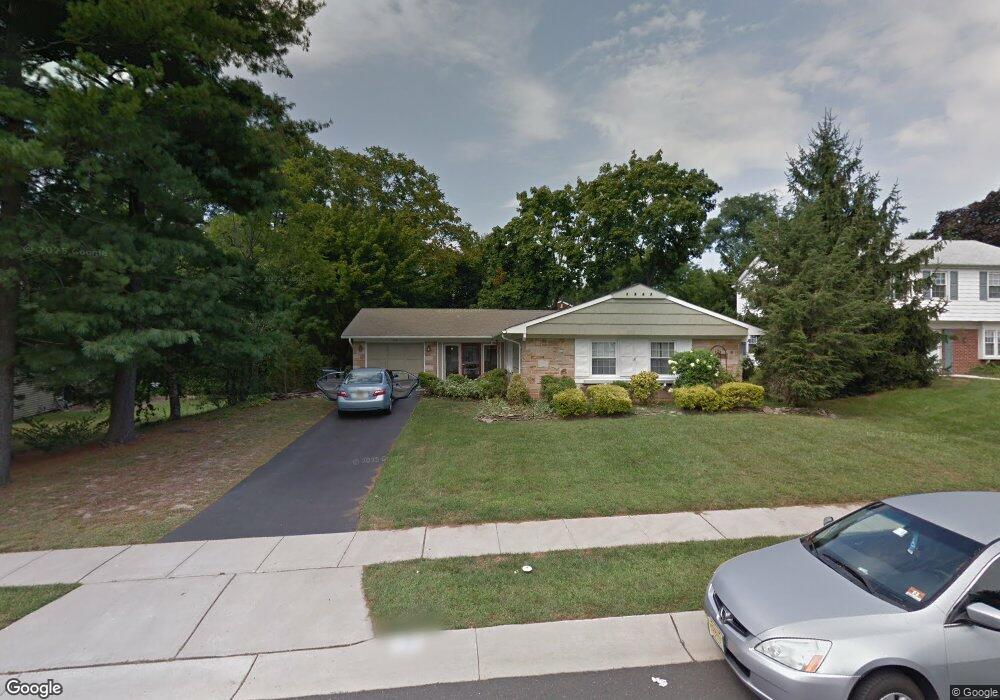
125 Idlewild Ln Matawan, NJ 07747
Estimated Value: $624,944 - $692,000
3
Beds
2
Baths
1,457
Sq Ft
$447/Sq Ft
Est. Value
About This Home
This home is located at 125 Idlewild Ln, Matawan, NJ 07747 and is currently estimated at $651,236, approximately $446 per square foot. 125 Idlewild Ln is a home located in Monmouth County with nearby schools including Matawan Reg High School, St Benedict School, and St. Joseph Elementary School.
Ownership History
Date
Name
Owned For
Owner Type
Purchase Details
Closed on
Jan 30, 2004
Sold by
Hoover Michael
Bought by
Walsh Peter and Walsh Patricia
Current Estimated Value
Home Financials for this Owner
Home Financials are based on the most recent Mortgage that was taken out on this home.
Original Mortgage
$299,250
Outstanding Balance
$138,786
Interest Rate
5.67%
Estimated Equity
$512,450
Purchase Details
Closed on
Dec 19, 2001
Sold by
Hoover Gregory
Bought by
Hoover Michael and Hoover Marianne
Create a Home Valuation Report for This Property
The Home Valuation Report is an in-depth analysis detailing your home's value as well as a comparison with similar homes in the area
Home Values in the Area
Average Home Value in this Area
Purchase History
| Date | Buyer | Sale Price | Title Company |
|---|---|---|---|
| Walsh Peter | $315,000 | -- | |
| Hoover Michael | $100,000 | -- |
Source: Public Records
Mortgage History
| Date | Status | Borrower | Loan Amount |
|---|---|---|---|
| Open | Walsh Peter | $299,250 |
Source: Public Records
Tax History Compared to Growth
Tax History
| Year | Tax Paid | Tax Assessment Tax Assessment Total Assessment is a certain percentage of the fair market value that is determined by local assessors to be the total taxable value of land and additions on the property. | Land | Improvement |
|---|---|---|---|---|
| 2025 | $10,222 | $573,900 | $409,500 | $164,400 |
| 2024 | $9,752 | $505,800 | $344,400 | $161,400 |
| 2023 | $9,752 | $455,900 | $298,300 | $157,600 |
| 2022 | $9,228 | $380,500 | $231,300 | $149,200 |
| 2021 | $9,228 | $341,400 | $208,700 | $132,700 |
| 2020 | $9,442 | $347,900 | $218,200 | $129,700 |
| 2019 | $9,329 | $333,900 | $204,900 | $129,000 |
| 2018 | $8,913 | $319,800 | $196,800 | $123,000 |
| 2017 | $8,552 | $311,200 | $177,800 | $133,400 |
| 2016 | $7,957 | $302,200 | $172,100 | $130,100 |
| 2015 | $8,380 | $305,500 | $178,800 | $126,700 |
| 2014 | $7,965 | $296,100 | $170,200 | $125,900 |
Source: Public Records
Map
Nearby Homes
- 13 Ivy Hill Dr
- 2 Avondale Ln
- 3 Avondale Ln
- 9 Tralee Rd
- 111 Courtland Ln
- 9 Idolstone Ln
- 101 Cresci Blvd
- 106 van Brackle Rd
- 129 Dumbarton Hill Ct
- 108 Dundee Ct
- 75 Bradford Ct Unit 75
- 141 Eastwick Ct Unit 141
- 570 Line Rd
- 68 Bradford Ct
- 31 Balmoral Ct
- 223 Perth Hill Ct Unit 223
- 537 S Atlantic Ave
- 184 Edinburgh Ct Unit 184
- 12 S Atlantic Ave Unit 14
- 3 Tolas Dr