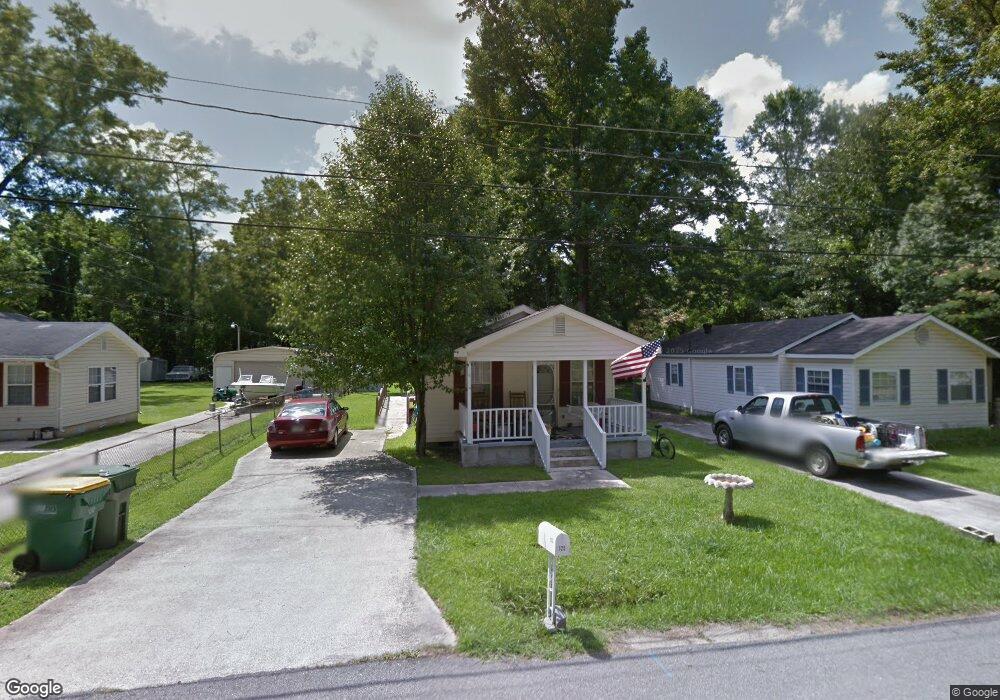
125 Kelly St Pooler, GA 31322
Estimated Value: $183,000 - $243,000
3
Beds
2
Baths
1,200
Sq Ft
$185/Sq Ft
Est. Value
About This Home
This home is located at 125 Kelly St, Pooler, GA 31322 and is currently estimated at $221,647, approximately $184 per square foot. 125 Kelly St is a home located in Chatham County with nearby schools including Pooler Elementary School, West Chatham Middle School, and Groves High School.
Ownership History
Date
Name
Owned For
Owner Type
Purchase Details
Closed on
Sep 22, 2014
Sold by
Fowler Benjamin Wayne
Bought by
Munn Tonya Fowler
Current Estimated Value
Purchase Details
Closed on
Aug 15, 2014
Sold by
Dillon Joseph Francis
Bought by
Dillon Joseph Francis and Dillon Harriett Miller
Purchase Details
Closed on
Jan 21, 2014
Sold by
Fowler Margaret L
Bought by
Munn Tonya Fowler
Purchase Details
Closed on
Apr 22, 2011
Sold by
Fowler Benjamin
Bought by
Fowler Benjamin W and Fowler Margaret L
Home Financials for this Owner
Home Financials are based on the most recent Mortgage that was taken out on this home.
Original Mortgage
$63,529
Interest Rate
4.81%
Mortgage Type
FHA
Purchase Details
Closed on
Aug 3, 2010
Sold by
Bac Home Loans Servicing L
Bought by
Sec Of Housing & Urban
Create a Home Valuation Report for This Property
The Home Valuation Report is an in-depth analysis detailing your home's value as well as a comparison with similar homes in the area
Home Values in the Area
Average Home Value in this Area
Purchase History
| Date | Buyer | Sale Price | Title Company |
|---|---|---|---|
| Munn Tonya Fowler | -- | -- | |
| Dillon Joseph Francis | -- | -- | |
| Munn Tonya Fowler | -- | -- | |
| Fowler Benjamin W | -- | -- | |
| Fowler Benjamin W | -- | -- | |
| Fowler Benjamin | $63,000 | -- | |
| Fowler Benjamin | $63,000 | -- | |
| Sec Of Housing & Urban | $88,034 | -- | |
| Bac Home Loans Servicing Lp | $88,034 | -- |
Source: Public Records
Mortgage History
| Date | Status | Borrower | Loan Amount |
|---|---|---|---|
| Previous Owner | Fowler Benjamin | $63,529 |
Source: Public Records
Tax History Compared to Growth
Tax History
| Year | Tax Paid | Tax Assessment Tax Assessment Total Assessment is a certain percentage of the fair market value that is determined by local assessors to be the total taxable value of land and additions on the property. | Land | Improvement |
|---|---|---|---|---|
| 2025 | $1,694 | $62,040 | $24,000 | $38,040 |
| 2024 | $1,694 | $48,960 | $18,000 | $30,960 |
| 2023 | $1,418 | $44,400 | $10,520 | $33,880 |
| 2022 | $1,102 | $41,000 | $10,520 | $30,480 |
| 2021 | $1,108 | $32,160 | $6,000 | $26,160 |
| 2020 | $1,051 | $32,000 | $6,000 | $26,000 |
| 2019 | $1,051 | $30,760 | $6,000 | $24,760 |
| 2018 | $958 | $28,000 | $6,000 | $22,000 |
| 2017 | $906 | $28,280 | $6,000 | $22,280 |
| 2016 | $915 | $28,520 | $6,000 | $22,520 |
| 2015 | $922 | $28,600 | $5,240 | $23,360 |
| 2014 | $477 | $29,800 | $0 | $0 |
Source: Public Records
Map
Nearby Homes