Estimated Value: $91,000 - $149,000
2
Beds
1
Bath
1,272
Sq Ft
$90/Sq Ft
Est. Value
About This Home
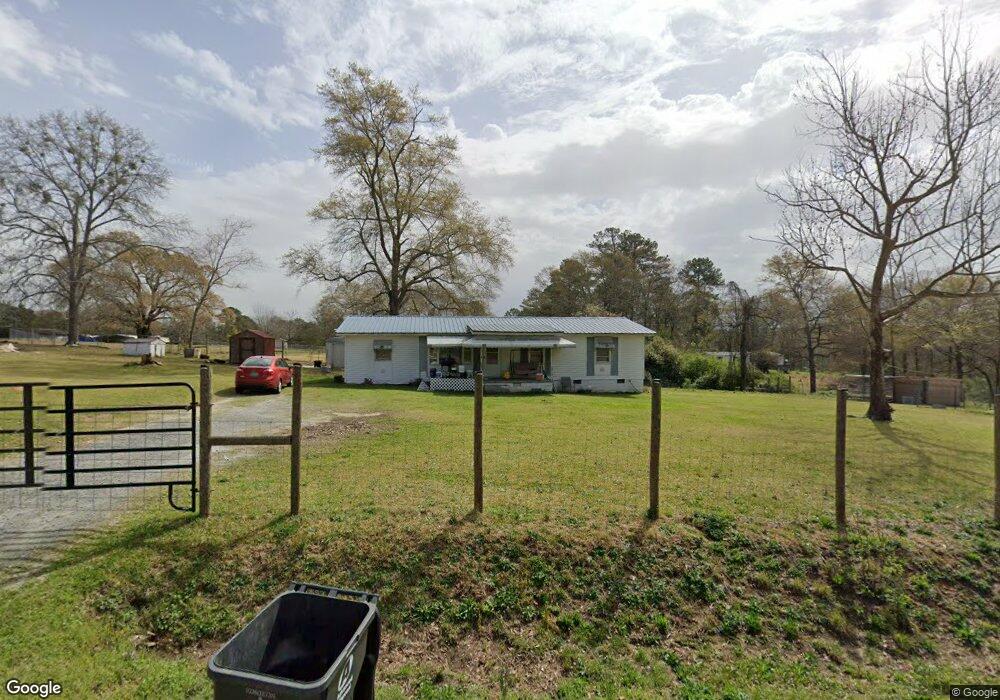
This home is located at 125 Kimberly Dr, Byron, GA 31008 and is currently estimated at $113,897, approximately $89 per square foot. 125 Kimberly Dr is a home located in Peach County with nearby schools including Kay Road Elementary School, Fort Valley Middle School, and Peach County High School.
Ownership History
Date
Name
Owned For
Owner Type
Purchase Details
Closed on
Aug 27, 2018
Sold by
Nix Christopher
Bought by
Nix Christopher and Younger Deanna
Current Estimated Value
Home Financials for this Owner
Home Financials are based on the most recent Mortgage that was taken out on this home.
Original Mortgage
$56,565
Outstanding Balance
$49,135
Interest Rate
4.51%
Estimated Equity
$64,762
Purchase Details
Closed on
Aug 24, 2018
Sold by
Hardison James G
Bought by
Nix Christopher
Home Financials for this Owner
Home Financials are based on the most recent Mortgage that was taken out on this home.
Original Mortgage
$56,565
Outstanding Balance
$49,135
Interest Rate
4.51%
Estimated Equity
$64,762
Purchase Details
Closed on
Apr 29, 2001
Sold by
Hyatt Lora L
Bought by
Hardison James G
Purchase Details
Closed on
Apr 5, 2000
Sold by
Hyatt Lora L
Bought by
Hyatt Lora L and Hyatt James
Purchase Details
Closed on
Aug 23, 1990
Bought by
Hyatt Lora L
Create a Home Valuation Report for This Property
The Home Valuation Report is an in-depth analysis detailing your home's value as well as a comparison with similar homes in the area
Home Values in the Area
Average Home Value in this Area
Purchase History
| Date | Buyer | Sale Price | Title Company |
|---|---|---|---|
| Nix Christopher | -- | -- | |
| Nix Christopher | $56,000 | -- | |
| Hardison James G | -- | -- | |
| Hyatt Lora L | -- | -- | |
| Hyatt Lora L | $42,900 | -- |
Source: Public Records
Mortgage History
| Date | Status | Borrower | Loan Amount |
|---|---|---|---|
| Open | Nix Christopher | $56,565 |
Source: Public Records
Tax History Compared to Growth
Tax History
| Year | Tax Paid | Tax Assessment Tax Assessment Total Assessment is a certain percentage of the fair market value that is determined by local assessors to be the total taxable value of land and additions on the property. | Land | Improvement |
|---|---|---|---|---|
| 2024 | $850 | $24,200 | $8,680 | $15,520 |
| 2023 | $792 | $21,840 | $6,000 | $15,840 |
| 2022 | $738 | $19,840 | $6,000 | $13,840 |
| 2021 | $755 | $17,640 | $6,000 | $11,640 |
| 2020 | $912 | $22,680 | $6,000 | $16,680 |
| 2019 | $899 | $22,160 | $6,000 | $16,160 |
| 2018 | $835 | $20,000 | $6,000 | $14,000 |
| 2017 | $838 | $20,000 | $6,000 | $14,000 |
| 2016 | $858 | $20,720 | $6,720 | $14,000 |
| 2015 | $820 | $19,480 | $5,480 | $14,000 |
| 2014 | $821 | $19,480 | $5,480 | $14,000 |
| 2013 | -- | $19,480 | $5,480 | $14,000 |
Source: Public Records
Map
Nearby Homes
- 0 Barker Rd Unit 243030
- 0 Barker Rd Unit 14258525
- 0 Barker Rd Unit 175053
- 81 Idell Ct
- 510 Southland Trail
- 408 Dixieland Dr
- 152 Hawks Ridge Trace
- 127 Hawks Ridge Trace
- 117 Hawks Ridge Trace
- 120 Hawks Ridge Trace
- 120 Hawks Place
- 109 Red Tail Cir
- 107 Red Tail Cir
- 165 Lakeview Rd
- 302 Southland Trail
- 199 Red Tail Cir
- 219 Rowland Cir
- 1046 Walker Rd