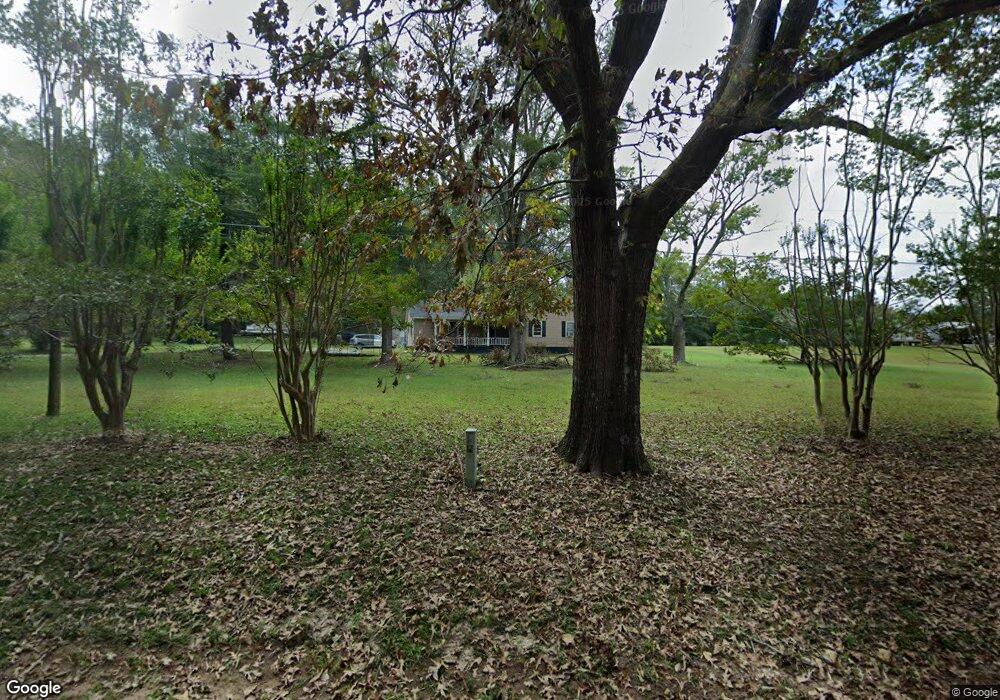
125 Lanford Rd Pauline, SC 29374
Estimated Value: $154,000 - $260,000
3
Beds
2
Baths
1,664
Sq Ft
$121/Sq Ft
Est. Value
About This Home
This home is located at 125 Lanford Rd, Pauline, SC 29374 and is currently estimated at $202,165, approximately $121 per square foot. 125 Lanford Rd is a home located in Spartanburg County with nearby schools including Dorman High School Freshman Campus and Dorman High School.
Ownership History
Date
Name
Owned For
Owner Type
Purchase Details
Closed on
Jan 5, 2016
Sold by
Ebrahim Sanober
Bought by
Shahjee Llc
Current Estimated Value
Purchase Details
Closed on
Nov 20, 2012
Sold by
Wells Fargo Bank National Association
Bought by
Ebrahim Sanober
Purchase Details
Closed on
Sep 24, 2012
Sold by
Struble David Richard
Bought by
Wells Fargo Bank National Association
Purchase Details
Closed on
Oct 25, 2006
Sold by
Holliday Amy M and Holliday Hugh D
Bought by
Struble David Richard
Home Financials for this Owner
Home Financials are based on the most recent Mortgage that was taken out on this home.
Original Mortgage
$6,250
Interest Rate
6.27%
Mortgage Type
Unknown
Purchase Details
Closed on
Sep 28, 2006
Sold by
Crain Sarah H
Bought by
Holliday Amy M and Holliday Hugh D
Home Financials for this Owner
Home Financials are based on the most recent Mortgage that was taken out on this home.
Original Mortgage
$6,250
Interest Rate
6.27%
Mortgage Type
Unknown
Create a Home Valuation Report for This Property
The Home Valuation Report is an in-depth analysis detailing your home's value as well as a comparison with similar homes in the area
Home Values in the Area
Average Home Value in this Area
Purchase History
| Date | Buyer | Sale Price | Title Company |
|---|---|---|---|
| Shahjee Llc | -- | None Available | |
| Ebrahim Sanober | $51,000 | -- | |
| Wells Fargo Bank National Association | $79,110 | -- | |
| Struble David Richard | $125,000 | None Available | |
| Holliday Amy M | $90,000 | None Available |
Source: Public Records
Mortgage History
| Date | Status | Borrower | Loan Amount |
|---|---|---|---|
| Previous Owner | Struble David Richard | $6,250 | |
| Previous Owner | Struble David Richard | $112,500 | |
| Previous Owner | Holliday Amy M | $90,000 |
Source: Public Records
Tax History Compared to Growth
Tax History
| Year | Tax Paid | Tax Assessment Tax Assessment Total Assessment is a certain percentage of the fair market value that is determined by local assessors to be the total taxable value of land and additions on the property. | Land | Improvement |
|---|---|---|---|---|
| 2025 | $2,574 | $7,653 | $812 | $6,841 |
| 2024 | $2,574 | $7,653 | $812 | $6,841 |
| 2023 | $2,574 | $7,653 | $812 | $6,841 |
| 2022 | $2,392 | $6,654 | $696 | $5,958 |
| 2021 | $2,392 | $6,654 | $696 | $5,958 |
| 2020 | $2,372 | $6,654 | $696 | $5,958 |
| 2019 | $2,372 | $6,654 | $696 | $5,958 |
| 2018 | $2,372 | $6,654 | $696 | $5,958 |
| 2017 | $2,064 | $5,892 | $696 | $5,196 |
| 2016 | $2,043 | $5,892 | $696 | $5,196 |
| 2015 | $2,020 | $5,649 | $667 | $4,982 |
| 2014 | $1,969 | $5,892 | $696 | $5,196 |
Source: Public Records
Map
Nearby Homes
- 2019 State Road S-42-90
- 2015 State Road S-42-90
- 2109 State Road S-42-90
- 5209 S Carolina 215
- 220 Fincher Rd
- 4909 Stone Station Rd
- 150 Gibson Rd
- 5455 Highway 215
- 315 Sabrewood Ln
- Harrison Rd
- 660 Hunters Rd
- 4065 Glenn Springs Rd
- 340 Harrison Rd
- 0 Glenn Springs Rd Unit 24690865
- 0 Glenn Springs Rd Unit 1568706
- 0 Glenn Springs Rd Unit SPN328505
- 95 State Road S-42-9964
- 95 Stone Station Farm
- 881 Inverness Cir
- 608 Virginia Pine Ct