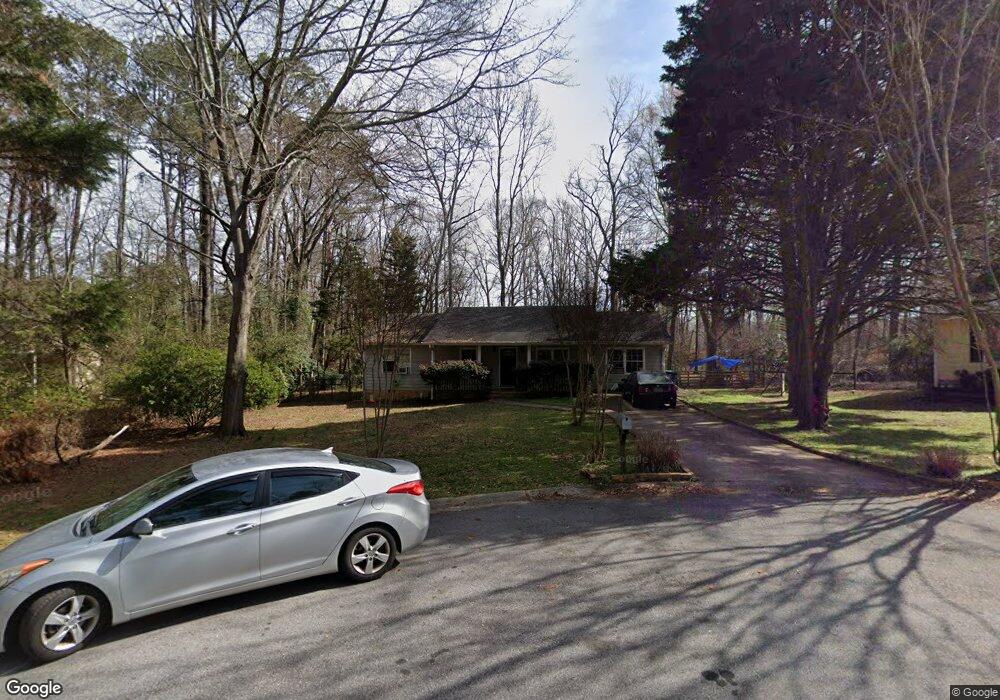
125 Longbranch Ct Athens, GA 30605
Cedar Creek NeighborhoodEstimated Value: $266,887 - $275,000
--
Bed
--
Bath
1,439
Sq Ft
$187/Sq Ft
Est. Value
About This Home
This home is located at 125 Longbranch Ct, Athens, GA 30605 and is currently estimated at $269,722, approximately $187 per square foot. 125 Longbranch Ct is a home located in Clarke County with nearby schools including Hilsman Middle School, Cedar Shoals High School, and Athens Montessori School.
Ownership History
Date
Name
Owned For
Owner Type
Purchase Details
Closed on
Sep 6, 2006
Sold by
Not Provided
Bought by
Straw Kyle E
Current Estimated Value
Purchase Details
Closed on
Aug 31, 2006
Sold by
Not Provided
Bought by
Straw Kyle E
Purchase Details
Closed on
Jun 10, 1999
Sold by
Thrash Kyle E Aka Kyle E Straw
Bought by
Thrash Kyle E Aka Kyle E Straw and Thrash Ro
Purchase Details
Closed on
May 1, 1999
Sold by
Thrash Kyle E and Thrash Robert F
Bought by
Thrash Kyle E Aka Kyle E Straw
Purchase Details
Closed on
Feb 25, 1997
Sold by
Straw Kyle E
Bought by
Thrash Kyle E and Thrash Robert F
Purchase Details
Closed on
Oct 4, 1995
Sold by
Straw John W and Straw Kyle E
Bought by
Straw Kyle E
Create a Home Valuation Report for This Property
The Home Valuation Report is an in-depth analysis detailing your home's value as well as a comparison with similar homes in the area
Home Values in the Area
Average Home Value in this Area
Purchase History
| Date | Buyer | Sale Price | Title Company |
|---|---|---|---|
| Straw Kyle E | -- | -- | |
| Straw Kyle E | -- | -- | |
| Straw Kyle E | -- | -- | |
| Straw Kyle E | -- | -- | |
| Straw Kyle E | -- | -- | |
| Straw Kyle E | -- | -- | |
| Thrash Kyle E Aka Kyle E Straw | -- | -- | |
| Thrash Kyle E Aka Kyle E Straw | -- | -- | |
| Thrash Kyle E | -- | -- | |
| Straw Kyle E | -- | -- |
Source: Public Records
Tax History Compared to Growth
Tax History
| Year | Tax Paid | Tax Assessment Tax Assessment Total Assessment is a certain percentage of the fair market value that is determined by local assessors to be the total taxable value of land and additions on the property. | Land | Improvement |
|---|---|---|---|---|
| 2025 | $2,971 | $95,694 | $12,000 | $83,694 |
| 2024 | $2,971 | $87,986 | $12,000 | $75,986 |
| 2023 | $2,750 | $78,921 | $12,000 | $66,921 |
| 2022 | $2,195 | $68,821 | $10,400 | $58,421 |
| 2021 | $1,548 | $55,927 | $10,400 | $45,527 |
| 2020 | $1,706 | $50,636 | $10,400 | $40,236 |
| 2019 | $1,550 | $45,663 | $10,400 | $35,263 |
| 2018 | $1,375 | $40,510 | $8,800 | $31,710 |
| 2017 | $1,212 | $35,685 | $8,800 | $26,885 |
| 2016 | $1,159 | $34,150 | $8,800 | $25,350 |
| 2015 | $1,090 | $32,046 | $8,800 | $23,246 |
| 2014 | $1,095 | $32,165 | $8,800 | $23,365 |
Source: Public Records
Map
Nearby Homes
- 115 Longbranch Ct
- 145 Shadow Moss Dr
- 137 Shadow Moss Dr
- 135 Shadow Moss Dr
- 130 Longbranch Ct
- 120 Longbranch Ct
- 110 Longbranch Ct
- 127 Shadow Moss Dr
- 110 Meadow Creek Dr
- 108 Meadow Creek Dr
- 165 Shadow Moss Dr
- 125 Shadow Moss Dr
- 106 Meadow Creek Dr
- 117 Shadow Moss Dr
- 104 Meadow Creek Dr
- 114 Meadow Creek Dr
- 121 Pembrook Ct
- 140 Shadow Moss Dr
- 150 Shadow Moss Dr
- 111 Pembrook Ct