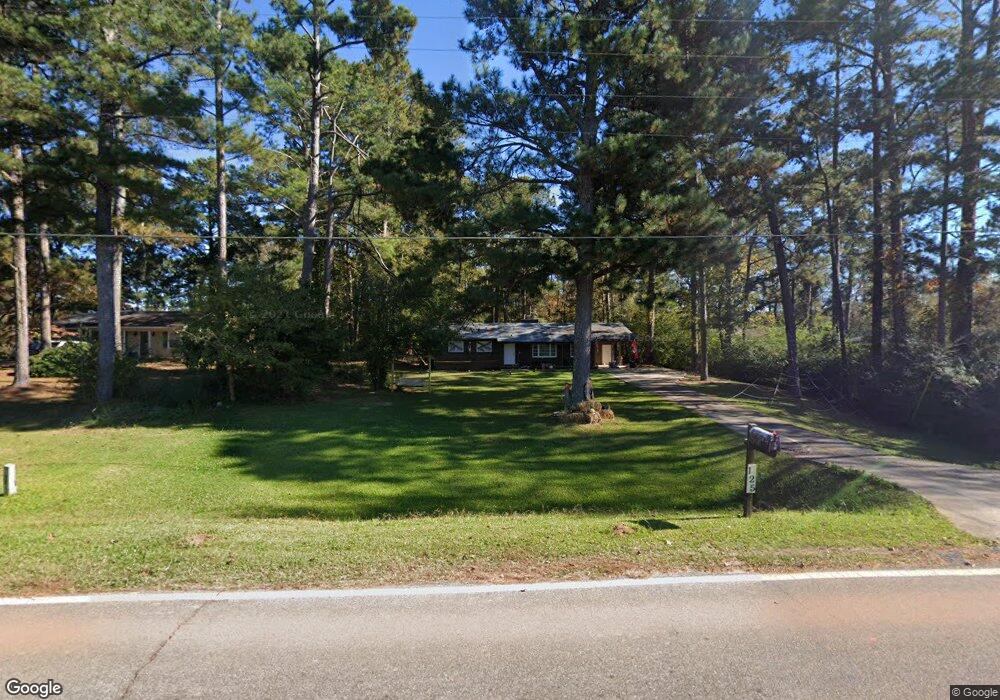
125 Maley Rd Lagrange, GA 30240
Estimated Value: $196,310 - $243,000
3
Beds
2
Baths
1,404
Sq Ft
$158/Sq Ft
Est. Value
About This Home
This home is located at 125 Maley Rd, Lagrange, GA 30240 and is currently estimated at $222,328, approximately $158 per square foot. 125 Maley Rd is a home located in Troup County with nearby schools including Long Cane Elementary School, Berta Weathersbee Elementary School, and Whitesville Road Elementary School.
Ownership History
Date
Name
Owned For
Owner Type
Purchase Details
Closed on
Apr 18, 1992
Sold by
Thomas Ronald M
Bought by
Morgan Judith Lynette
Current Estimated Value
Purchase Details
Closed on
Sep 20, 1982
Sold by
Pittman Richard Lee and Pittman Diana
Bought by
Thomas Ronald M
Purchase Details
Closed on
Jan 12, 1979
Sold by
Mcconnell William and Mcconnell Quillian
Bought by
Pittman Richard Lee and Pittman Diana
Purchase Details
Closed on
May 29, 1977
Sold by
Pollard Roger D
Bought by
Mcconnell William and Mcconnell Quillian
Purchase Details
Closed on
Jan 29, 1976
Sold by
First Federal Savings & Loan
Bought by
Pollard Roger D
Purchase Details
Closed on
Sep 2, 1975
Sold by
Clontz James C and Clontz Barbara B
Bought by
First Federal Savings & Loan
Purchase Details
Closed on
Jan 1, 1973
Sold by
Greco Const Co
Bought by
Clontz James C and Clontz Barbara B
Purchase Details
Closed on
Jan 1, 1972
Sold by
Teaver James
Bought by
Greco Const Co
Create a Home Valuation Report for This Property
The Home Valuation Report is an in-depth analysis detailing your home's value as well as a comparison with similar homes in the area
Purchase History
| Date | Buyer | Sale Price | Title Company |
|---|---|---|---|
| Morgan Judith Lynette | -- | -- | |
| Thomas Ronald M | $44,000 | -- | |
| Pittman Richard Lee | $37,000 | -- | |
| Mcconnell William | $33,000 | -- | |
| Pollard Roger D | $29,600 | -- | |
| First Federal Savings & Loan | -- | -- | |
| Clontz James C | $2,500 | -- | |
| Greco Const Co | -- | -- |
Source: Public Records
Tax History
| Year | Tax Paid | Tax Assessment Tax Assessment Total Assessment is a certain percentage of the fair market value that is determined by local assessors to be the total taxable value of land and additions on the property. | Land | Improvement |
|---|---|---|---|---|
| 2025 | $2,196 | $80,520 | $10,000 | $70,520 |
| 2024 | $1,452 | $53,240 | $8,000 | $45,240 |
| 2023 | $1,430 | $52,440 | $8,000 | $44,440 |
| 2022 | $1,389 | $49,760 | $8,000 | $41,760 |
| 2021 | $1,087 | $36,040 | $8,000 | $28,040 |
| 2020 | $1,087 | $36,040 | $8,000 | $28,040 |
| 2019 | $1,019 | $33,800 | $6,000 | $27,800 |
| 2018 | $943 | $31,280 | $6,000 | $25,280 |
| 2017 | $943 | $31,280 | $6,000 | $25,280 |
| 2016 | $917 | $30,404 | $6,000 | $24,404 |
| 2015 | $919 | $30,404 | $6,000 | $24,404 |
| 2014 | $881 | $29,119 | $6,000 | $23,119 |
| 2013 | -- | $30,818 | $6,000 | $24,818 |
Source: Public Records
Map
Nearby Homes
- 112 Foxdale Dr
- 245 Teaver Rd
- 640 Hudson Rd
- 0 Glass Bridge Rd Unit 10679358
- 113 Colonial Ct
- 104 Independence Ct
- 311 Cumberland Dr
- 101 Ivy Springs Dr
- 98 Hearn Rd
- 808 S Fling Rd
- 474 Newton Rd
- 16 River Point Dr
- 40 River Point Dr
- 129 Angela East Dr
- 4.5 ACRES Whatley Rd N
- 0 Deming St Unit 10550189
- 0 Salem Rd Tract 2 Unit 10675187
- 402 Ginger Cir
- 427 Fling Rd
- 8 Horace Carter Rd
Your Personal Tour Guide
Ask me questions while you tour the home.