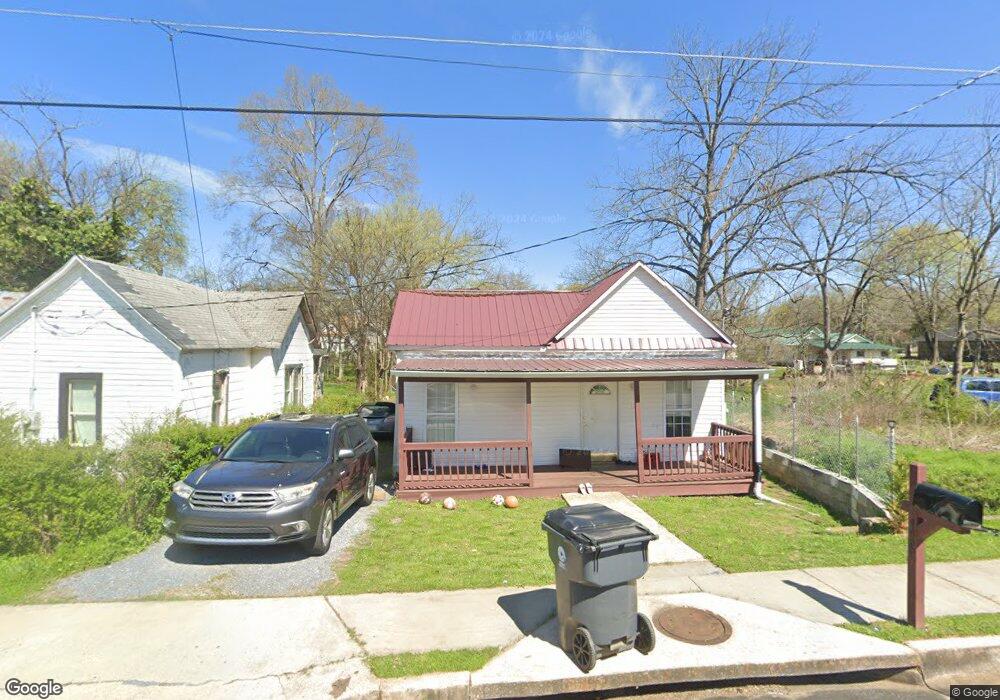
125 Marietta St Cedartown, GA 30125
Estimated Value: $48,864 - $196,000
3
Beds
1
Bath
1,544
Sq Ft
$73/Sq Ft
Est. Value
About This Home
This home is located at 125 Marietta St, Cedartown, GA 30125 and is currently estimated at $113,466, approximately $73 per square foot. 125 Marietta St is a home located in Polk County with nearby schools including Cedar Christian School and Vineyard Harvester Christian Academy.
Ownership History
Date
Name
Owned For
Owner Type
Purchase Details
Closed on
Jan 27, 2023
Sold by
Perez Melvin Rene Gonzalez
Bought by
Puac Nolasco Armin and Ortiz Audacely Roblero
Current Estimated Value
Purchase Details
Closed on
Dec 15, 2021
Sold by
Dufour John
Bought by
Perez Melvin Rene Gonzalez
Purchase Details
Closed on
Jun 24, 2009
Sold by
First Tennessee Bank Natio
Bought by
Dufour John
Purchase Details
Closed on
Jun 5, 2007
Sold by
Sanford Ralph
Bought by
First Tennessee Bank National
Purchase Details
Closed on
Feb 21, 2003
Sold by
Manufacturers And Traders Trust Company
Bought by
Sanford Ralph
Purchase Details
Closed on
Jul 2, 2002
Sold by
Diamond Dooley Sr Atty In Fact Manufactu
Bought by
Manufacturers & Traders Trust Co
Purchase Details
Closed on
Aug 10, 1990
Sold by
Diamond Deborah E
Bought by
Diamond Dooley Sr
Purchase Details
Closed on
Jan 25, 1963
Sold by
Cato Emma Lou
Bought by
Diamond Irene G
Purchase Details
Closed on
Jan 1, 1901
Bought by
Cato Emma Lou
Create a Home Valuation Report for This Property
The Home Valuation Report is an in-depth analysis detailing your home's value as well as a comparison with similar homes in the area
Home Values in the Area
Average Home Value in this Area
Purchase History
| Date | Buyer | Sale Price | Title Company |
|---|---|---|---|
| Puac Nolasco Armin | -- | -- | |
| Perez Melvin Rene Gonzalez | $15,000 | -- | |
| Dufour John | $11,000 | -- | |
| First Tennessee Bank National | $20,000 | -- | |
| Sanford Ralph | $4,500 | -- | |
| Manufacturers & Traders Trust Co | -- | -- | |
| Diamond Dooley Sr | -- | -- | |
| Diamond Irene G | -- | -- | |
| Cato Emma Lou | -- | -- |
Source: Public Records
Tax History Compared to Growth
Tax History
| Year | Tax Paid | Tax Assessment Tax Assessment Total Assessment is a certain percentage of the fair market value that is determined by local assessors to be the total taxable value of land and additions on the property. | Land | Improvement |
|---|---|---|---|---|
| 2024 | $590 | $18,670 | $6,000 | $12,670 |
| 2023 | $284 | $8,192 | $286 | $7,906 |
| 2022 | $142 | $7,016 | $286 | $6,730 |
| 2021 | $169 | $7,016 | $286 | $6,730 |
| 2020 | $169 | $7,016 | $286 | $6,730 |
| 2019 | $200 | $7,430 | $812 | $6,618 |
| 2018 | $195 | $7,085 | $696 | $6,389 |
| 2017 | $193 | $7,085 | $696 | $6,389 |
| 2016 | $205 | $7,528 | $696 | $6,832 |
| 2015 | $211 | $7,720 | $696 | $7,024 |
| 2014 | $212 | $7,720 | $696 | $7,024 |
Source: Public Records
Map
Nearby Homes
- 129 Thompson St
- 226 Central St
- 729 S College St
- 217 E Gibson St
- 129 W Ellawood Ave
- 151 W Ellawood Ave
- 0 Philpot Springs Unit 10626665
- 234 Brooks St
- 427 Park St
- 328 330 Stubbs
- 634 Georgia Ave
- 634 Georgia Ave Unit 123
- 149 Irwin St
- 2460 Hidden Creek Rd
- 537 Fletcher St
- 208 Highland Ave
- 325 Fairview Ave
- 328 Mountain Home Rd
- 601 Mountain Home Rd
- 00 Juliette St
- 121 Marietta St
- 203 Marietta St
- 128 Thompson St
- 124 Thompson St
- 205 Marietta St
- 113 Marietta St
- 118 Thompson St
- 130 Marietta St
- 204 Thompson St
- 206 Thompson St
- 116 Thompson St
- 207 Marietta St
- 212 Thompson St
- 215 Marietta St
- 129 Martin Luther King jr Blvd
- 207 Thompson St
- 216 Thompson St
- 218 Marietta St
- 823 S Main St
- 219 Marietta St