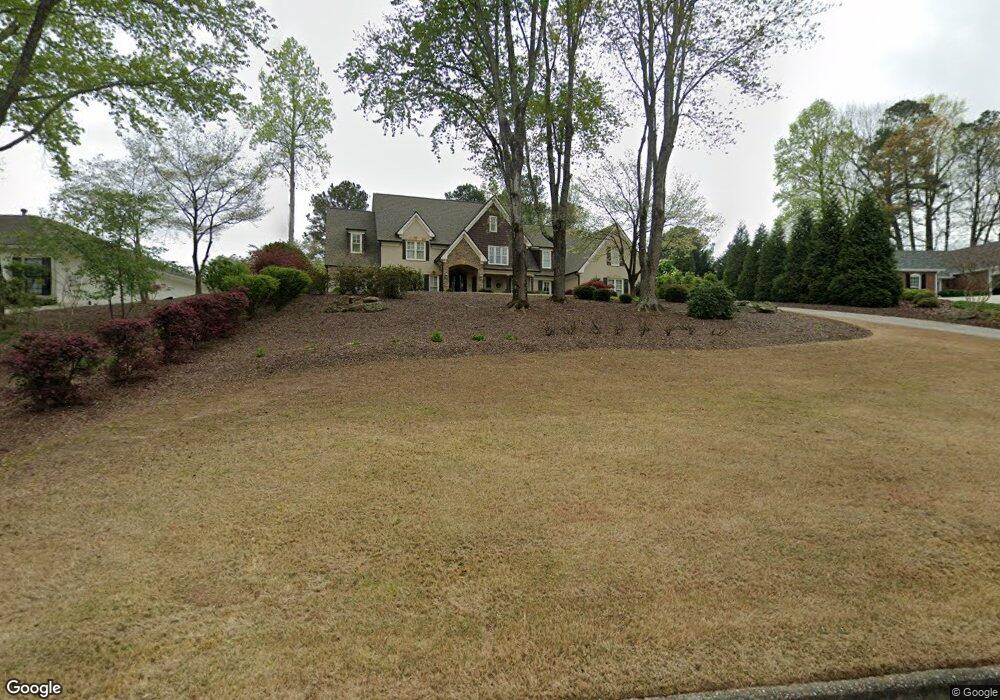
125 Mountain Shoals Rd Unit 9 Roswell, GA 30075
Brookfield West NeighborhoodEstimated Value: $1,070,000 - $1,312,000
5
Beds
5
Baths
5,926
Sq Ft
$206/Sq Ft
Est. Value
About This Home
This home is located at 125 Mountain Shoals Rd Unit 9, Roswell, GA 30075 and is currently estimated at $1,222,914, approximately $206 per square foot. 125 Mountain Shoals Rd Unit 9 is a home located in Fulton County with nearby schools including Mountain Park Elementary School, Crabapple Middle School, and Fellowship Christian School.
Ownership History
Date
Name
Owned For
Owner Type
Purchase Details
Closed on
Mar 7, 2025
Sold by
Devigne Denise Paige
Bought by
Denise Paige Devigne Revocable Trust and Devigne Denise Paige Trust
Current Estimated Value
Purchase Details
Closed on
Feb 5, 2014
Sold by
Roberts Denise Devigne
Bought by
Devigne Denise Paige
Purchase Details
Closed on
Feb 25, 2011
Sold by
Roberts Mark P
Bought by
Roberts Denise D
Purchase Details
Closed on
Sep 22, 2000
Sold by
Brock George C and Brock Barbara P
Bought by
Roberts Mark P
Home Financials for this Owner
Home Financials are based on the most recent Mortgage that was taken out on this home.
Original Mortgage
$221,000
Interest Rate
7.92%
Mortgage Type
New Conventional
Purchase Details
Closed on
Sep 22, 1993
Sold by
Richards Robert W Veronica
Bought by
Brock George C Barbara P
Home Financials for this Owner
Home Financials are based on the most recent Mortgage that was taken out on this home.
Original Mortgage
$145,000
Interest Rate
7.19%
Create a Home Valuation Report for This Property
The Home Valuation Report is an in-depth analysis detailing your home's value as well as a comparison with similar homes in the area
Home Values in the Area
Average Home Value in this Area
Purchase History
| Date | Buyer | Sale Price | Title Company |
|---|---|---|---|
| Denise Paige Devigne Revocable Trust | -- | -- | |
| Devigne Denise Paige | -- | -- | |
| Roberts Denise D | -- | -- | |
| Roberts Mark P | $340,000 | -- | |
| Brock George C Barbara P | $230,000 | -- |
Source: Public Records
Mortgage History
| Date | Status | Borrower | Loan Amount |
|---|---|---|---|
| Previous Owner | Roberts Mark P | $221,000 | |
| Previous Owner | Brock George C Barbara P | $145,000 |
Source: Public Records
Tax History Compared to Growth
Tax History
| Year | Tax Paid | Tax Assessment Tax Assessment Total Assessment is a certain percentage of the fair market value that is determined by local assessors to be the total taxable value of land and additions on the property. | Land | Improvement |
|---|---|---|---|---|
| 2025 | $2,146 | $488,640 | $60,800 | $427,840 |
| 2023 | $2,146 | $418,720 | $54,040 | $364,680 |
| 2022 | $8,848 | $336,280 | $52,520 | $283,760 |
| 2021 | $9,129 | $286,640 | $45,600 | $241,040 |
| 2020 | $9,020 | $275,440 | $66,560 | $208,880 |
| 2019 | $1,439 | $290,480 | $56,960 | $233,520 |
| 2018 | $8,006 | $283,640 | $55,600 | $228,040 |
| 2017 | $7,129 | $244,360 | $33,480 | $210,880 |
| 2016 | $7,131 | $244,360 | $33,480 | $210,880 |
| 2015 | $8,493 | $244,360 | $33,480 | $210,880 |
| 2014 | $5,926 | $206,080 | $29,160 | $176,920 |
Source: Public Records
Map
Nearby Homes
- 5045 Rockingham Dr
- 1460 Lakemist Ct
- 4010 Rockingham Dr
- 140 E Lake Dr
- 865 Ferncroft Ct
- 130 W Lake Dr
- 870 Hickory Oak Hollow
- 112 Cherry 0 Cherry St
- 120 Cedarwood Ln
- 140 Cedarwood Ln
- 110 Cherry St
- 1005 Hedgerose Ln
- 110 Ansley Way
- 130 Cedarwood Ln
- 475 Laurian View Ct
- 12620 Old Surrey Place
- 570 Wheatridge Bluff
- 150 Cedarwood Ln
- 235 Winterberry Way
- 1065 Laurian Park Dr
- 135 Mountain Shoals Rd
- 135 Mountain Shoals Rd Unit 9
- 115 Mountain Shoals Rd Unit 9
- 0 Mountain Shoals Rd Unit 7070007
- 0 Mountain Shoals Rd Unit 8169856
- 0 Mountain Shoals Rd Unit 3071111
- 12175 Mountain Laurel Dr
- 145 Mountain Shoals Rd
- 12185 Mountain Laurel Dr
- 130 Mountain Shoals Rd
- 140 Mountain Shoals Rd Unit 9
- 155 Mountain Shoals Rd
- 150 Mountain Shoals Rd
- 205 Mountain Point
- 210 Mountain Point
- 12173 Mountain Laurel Dr
- 0 Mountain Point Unit 7315182
- 0 Mountain Point Unit 7025252
- 0 Mountain Point Unit 8011020
- 0 Mountain Point Unit 7288586