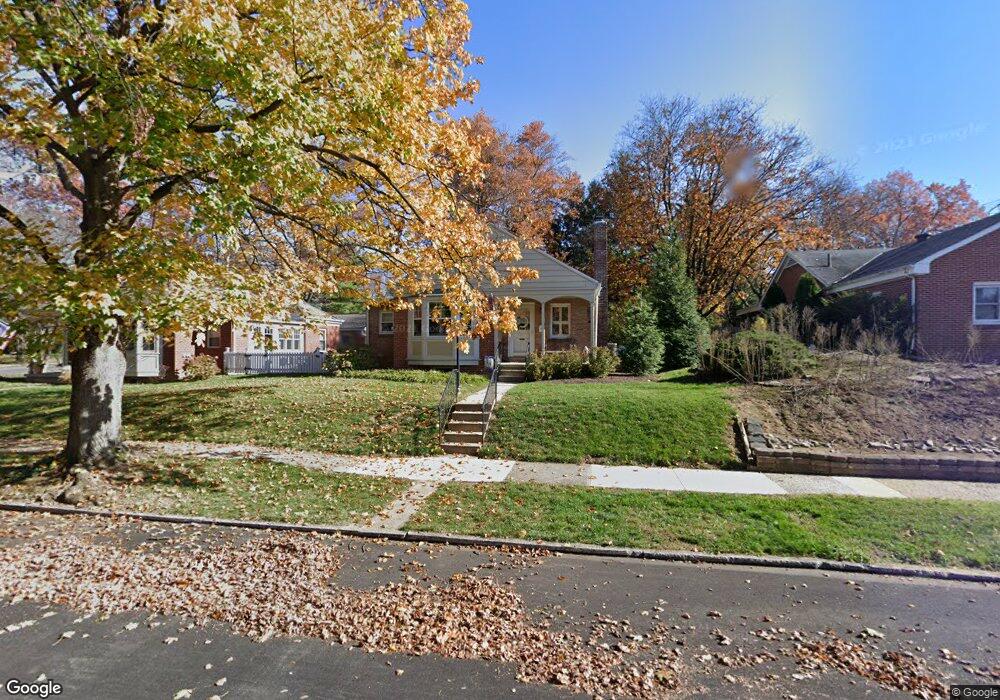
125 N 31st St Camp Hill, PA 17011
Estimated Value: $246,000 - $288,000
2
Beds
1
Bath
970
Sq Ft
$273/Sq Ft
Est. Value
About This Home
This home is located at 125 N 31st St, Camp Hill, PA 17011 and is currently estimated at $264,693, approximately $272 per square foot. 125 N 31st St is a home located in Cumberland County with nearby schools including Hoover Elementary School, Eisenhower Elementary School, and Camp Hill Middle School.
Ownership History
Date
Name
Owned For
Owner Type
Purchase Details
Closed on
Nov 18, 2022
Sold by
Hans Janice T
Bought by
Dean Nicole
Current Estimated Value
Home Financials for this Owner
Home Financials are based on the most recent Mortgage that was taken out on this home.
Original Mortgage
$213,750
Outstanding Balance
$207,122
Interest Rate
6.95%
Mortgage Type
New Conventional
Estimated Equity
$57,571
Purchase Details
Closed on
Mar 23, 2009
Sold by
Souder Randee L
Bought by
Hans Janice T
Home Financials for this Owner
Home Financials are based on the most recent Mortgage that was taken out on this home.
Original Mortgage
$70,000
Interest Rate
5.14%
Mortgage Type
New Conventional
Purchase Details
Closed on
Jun 29, 2000
Sold by
Mills Curtis J
Bought by
Souder Randee L
Home Financials for this Owner
Home Financials are based on the most recent Mortgage that was taken out on this home.
Original Mortgage
$70,800
Interest Rate
8.59%
Create a Home Valuation Report for This Property
The Home Valuation Report is an in-depth analysis detailing your home's value as well as a comparison with similar homes in the area
Home Values in the Area
Average Home Value in this Area
Purchase History
| Date | Buyer | Sale Price | Title Company |
|---|---|---|---|
| Dean Nicole | $225,000 | -- | |
| Hans Janice T | $140,000 | -- | |
| Souder Randee L | $88,500 | -- |
Source: Public Records
Mortgage History
| Date | Status | Borrower | Loan Amount |
|---|---|---|---|
| Open | Dean Nicole | $213,750 | |
| Previous Owner | Hans Janice T | $70,000 | |
| Previous Owner | Souder Randee L | $70,800 |
Source: Public Records
Tax History Compared to Growth
Tax History
| Year | Tax Paid | Tax Assessment Tax Assessment Total Assessment is a certain percentage of the fair market value that is determined by local assessors to be the total taxable value of land and additions on the property. | Land | Improvement |
|---|---|---|---|---|
| 2025 | $3,511 | $135,600 | $32,500 | $103,100 |
| 2024 | $3,352 | $135,600 | $32,500 | $103,100 |
| 2023 | $2,857 | $135,600 | $32,500 | $103,100 |
| 2022 | $3,164 | $135,600 | $32,500 | $103,100 |
| 2021 | $3,082 | $135,600 | $32,500 | $103,100 |
| 2020 | $3,014 | $135,600 | $32,500 | $103,100 |
| 2019 | $2,954 | $135,600 | $32,500 | $103,100 |
| 2018 | $2,891 | $135,600 | $32,500 | $103,100 |
| 2017 | $4,270 | $135,600 | $32,500 | $103,100 |
| 2016 | -- | $135,600 | $32,500 | $103,100 |
| 2015 | -- | $135,600 | $32,500 | $103,100 |
| 2014 | -- | $135,600 | $32,500 | $103,100 |
Source: Public Records
Map
Nearby Homes