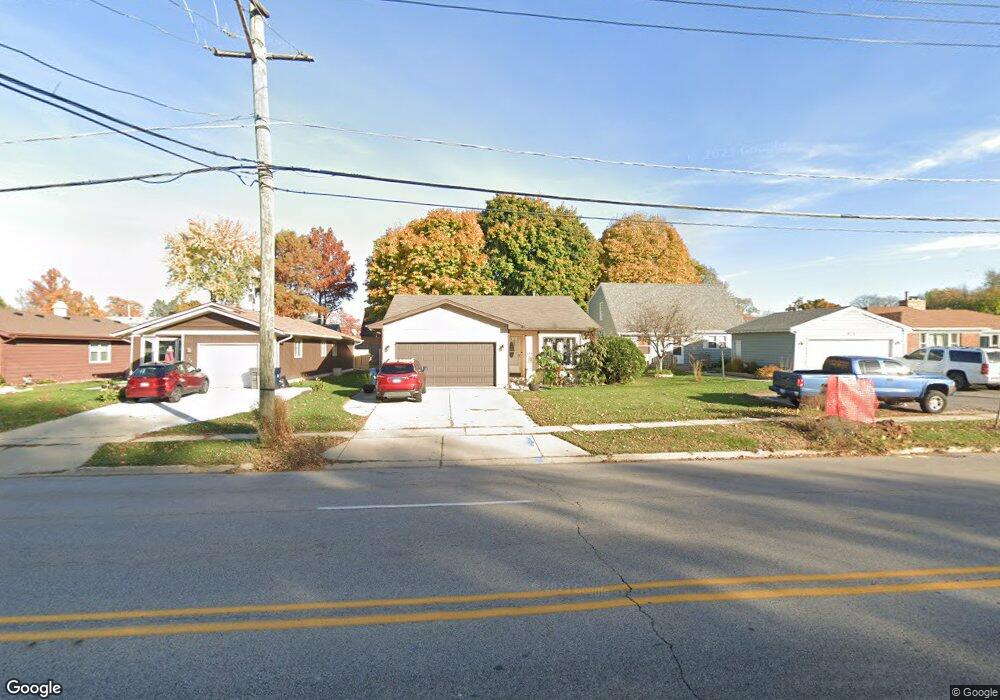
125 N Mclean Blvd Elgin, IL 60123
Near West Elgin NeighborhoodEstimated Value: $256,000 - $361,000
3
Beds
3
Baths
1,446
Sq Ft
$219/Sq Ft
Est. Value
About This Home
This home is located at 125 N Mclean Blvd, Elgin, IL 60123 and is currently estimated at $316,007, approximately $218 per square foot. 125 N Mclean Blvd is a home located in Kane County with nearby schools including Highland Elementary School, Kimball Middle School, and Larkin High School.
Ownership History
Date
Name
Owned For
Owner Type
Purchase Details
Closed on
Oct 16, 2013
Sold by
Wells Fargo Bank Na
Bought by
Alvarado Leticia
Current Estimated Value
Home Financials for this Owner
Home Financials are based on the most recent Mortgage that was taken out on this home.
Original Mortgage
$106,700
Interest Rate
4.87%
Mortgage Type
New Conventional
Purchase Details
Closed on
Sep 5, 2013
Sold by
Marshall Dietra
Bought by
Wells Fargo Bank Na
Home Financials for this Owner
Home Financials are based on the most recent Mortgage that was taken out on this home.
Original Mortgage
$106,700
Interest Rate
4.87%
Mortgage Type
New Conventional
Purchase Details
Closed on
Jul 11, 1995
Sold by
Wahl Fred O
Bought by
Marshall Dietra
Home Financials for this Owner
Home Financials are based on the most recent Mortgage that was taken out on this home.
Original Mortgage
$103,681
Interest Rate
7.79%
Mortgage Type
FHA
Create a Home Valuation Report for This Property
The Home Valuation Report is an in-depth analysis detailing your home's value as well as a comparison with similar homes in the area
Home Values in the Area
Average Home Value in this Area
Purchase History
| Date | Buyer | Sale Price | Title Company |
|---|---|---|---|
| Alvarado Leticia | $110,000 | Chicago Title Insurance Comp | |
| Wells Fargo Bank Na | -- | None Available | |
| Marshall Dietra | $108,000 | -- |
Source: Public Records
Mortgage History
| Date | Status | Borrower | Loan Amount |
|---|---|---|---|
| Previous Owner | Alvarado Leticia | $106,700 | |
| Previous Owner | Marshall Dietra | $103,681 |
Source: Public Records
Tax History
| Year | Tax Paid | Tax Assessment Tax Assessment Total Assessment is a certain percentage of the fair market value that is determined by local assessors to be the total taxable value of land and additions on the property. | Land | Improvement |
|---|---|---|---|---|
| 2024 | $6,497 | $89,188 | $16,467 | $72,721 |
| 2023 | $6,187 | $80,575 | $14,877 | $65,698 |
| 2022 | $5,850 | $73,470 | $13,565 | $59,905 |
| 2021 | $5,593 | $68,689 | $12,682 | $56,007 |
| 2020 | $5,433 | $65,574 | $12,107 | $53,467 |
| 2019 | $5,274 | $62,464 | $11,533 | $50,931 |
| 2018 | $5,225 | $58,845 | $10,865 | $47,980 |
| 2017 | $5,722 | $55,629 | $10,271 | $45,358 |
| 2016 | $5,504 | $51,609 | $9,529 | $42,080 |
| 2015 | -- | $47,304 | $8,734 | $38,570 |
| 2014 | -- | $46,720 | $8,626 | $38,094 |
| 2013 | -- | $47,953 | $8,854 | $39,099 |
Source: Public Records
Map
Nearby Homes
- 221 Heine Ave
- 308 N Clifton Ave
- 1059 Larkin Ave
- 1017 W Highland Ave
- 302 Hubbard Ave
- 70 S Weston Ave
- 44 Monroe St
- 121 Monroe Ave
- 1455 Erie St
- 336 Hamilton Ave
- 1849 Larkin Ave
- 1840 W Highland Ave Unit E-105
- 1419 Harlan Ave
- 262 S Weston Ave
- 118 Wilcox Ave
- 530 Cumberland Trail
- 527 N Lyle Ave
- 705 W Highland Ave
- 92 N Airlite St
- 118 S Union St
- 121 N Mclean Blvd
- 121 N Mclean Blvd
- 133 N Mclean Blvd
- 115 N Mclean Blvd
- 124 N Weston Ave
- 120 N Weston Ave
- 137 N Mclean Blvd
- 132 N Weston Ave
- 112 N Weston Ave
- 141 N Mclean Blvd
- 136 N Weston Ave
- 105 N Mclean Blvd
- 106 N Weston Ave
- 145 N Mclean Blvd
- 1420 Easy St
- 142 N Weston Ave
- 1308 Wolff Ave
- 110 N Mclean Blvd
- 1300 Wolff Ave
- 125 N Weston Ave
Your Personal Tour Guide
Ask me questions while you tour the home.