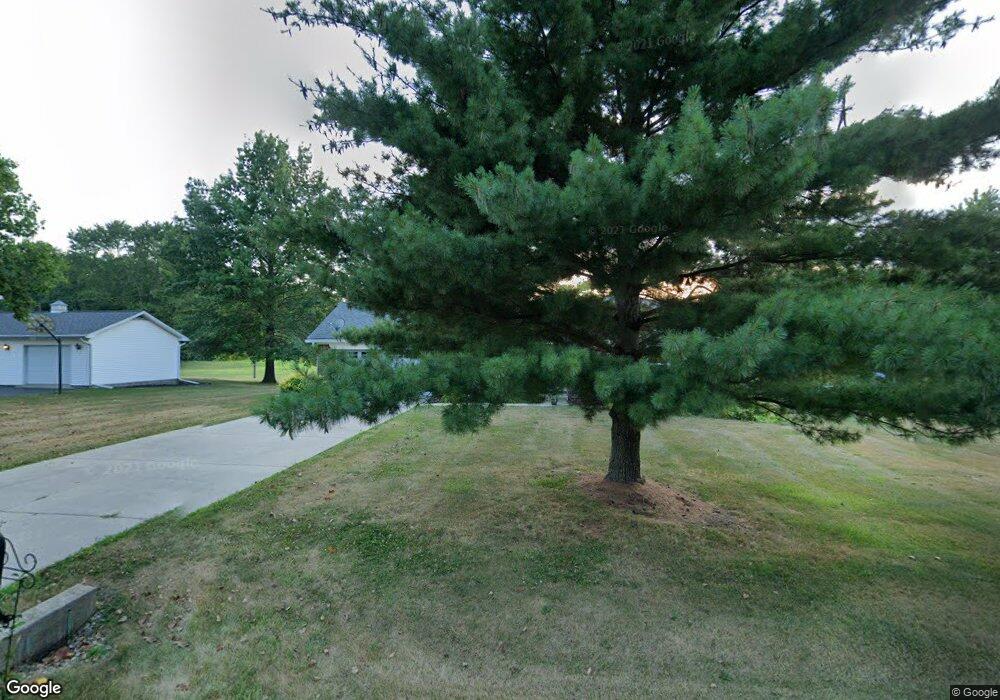
125 N Pleasant Run Crawfordsville, IN 47933
Estimated Value: $204,000 - $235,000
2
Beds
1
Bath
1,118
Sq Ft
$192/Sq Ft
Est. Value
About This Home
This home is located at 125 N Pleasant Run, Crawfordsville, IN 47933 and is currently estimated at $214,135, approximately $191 per square foot. 125 N Pleasant Run is a home located in Montgomery County with nearby schools including North Montgomery High School.
Ownership History
Date
Name
Owned For
Owner Type
Purchase Details
Closed on
Jun 21, 2022
Sold by
Bridges Andrew K and Bridges Cali L
Bought by
Douglas Megan L and Covault Lucas R
Current Estimated Value
Purchase Details
Closed on
Apr 24, 2020
Sold by
Phelps Ashley N
Bought by
Bridges Andrew K and Bridges Cali L
Purchase Details
Closed on
Mar 14, 2018
Sold by
Crossley Mary C
Bought by
Phelps Ashley N
Home Financials for this Owner
Home Financials are based on the most recent Mortgage that was taken out on this home.
Original Mortgage
$111,111
Interest Rate
4.32%
Mortgage Type
New Conventional
Purchase Details
Closed on
Feb 27, 2013
Sold by
Ratcliff Inc
Bought by
Moore Mary C
Home Financials for this Owner
Home Financials are based on the most recent Mortgage that was taken out on this home.
Original Mortgage
$91,836
Interest Rate
3.34%
Mortgage Type
New Conventional
Purchase Details
Closed on
Nov 9, 2012
Sold by
Leach John R and Leach Rachael L
Bought by
Ratcliff Inc
Create a Home Valuation Report for This Property
The Home Valuation Report is an in-depth analysis detailing your home's value as well as a comparison with similar homes in the area
Home Values in the Area
Average Home Value in this Area
Purchase History
| Date | Buyer | Sale Price | Title Company |
|---|---|---|---|
| Douglas Megan L | -- | Homann Kurt R | |
| Bridges Andrew K | -- | Partners Title Group Inc | |
| Phelps Ashley N | -- | Partners Title Group Inc | |
| Moore Mary C | -- | None Available | |
| Ratcliff Inc | -- | None Available |
Source: Public Records
Mortgage History
| Date | Status | Borrower | Loan Amount |
|---|---|---|---|
| Previous Owner | Phelps Ashley N | $111,111 | |
| Previous Owner | Moore Mary C | $91,836 |
Source: Public Records
Tax History Compared to Growth
Tax History
| Year | Tax Paid | Tax Assessment Tax Assessment Total Assessment is a certain percentage of the fair market value that is determined by local assessors to be the total taxable value of land and additions on the property. | Land | Improvement |
|---|---|---|---|---|
| 2024 | $1,581 | $166,400 | $22,900 | $143,500 |
| 2023 | $1,333 | $148,500 | $22,900 | $125,600 |
| 2022 | $1,436 | $140,900 | $22,900 | $118,000 |
| 2021 | $1,130 | $117,900 | $22,900 | $95,000 |
| 2020 | $987 | $119,600 | $22,900 | $96,700 |
| 2019 | $972 | $116,500 | $23,100 | $93,400 |
| 2018 | $989 | $124,600 | $28,600 | $96,000 |
| 2017 | $956 | $123,100 | $28,600 | $94,500 |
| 2016 | $406 | $118,200 | $28,600 | $89,600 |
| 2014 | $379 | $115,100 | $28,600 | $86,500 |
| 2013 | $379 | $110,800 | $28,600 | $82,200 |
Source: Public Records
Map
Nearby Homes
- 1987 E Placid Place
- 1906 Traction Rd
- 1501 Eastfield Dr
- 320 N Englewood Dr
- 2229 E Cadillac Dr
- 1715 Lebanon Rd Unit 3
- 1715 Lebanon Rd Unit 15
- 196 Crestwood Ave
- 6 W Park Ln
- 42 Diamond Ln
- 202 Diamond Ln
- 406 Louise Ave
- 405 Glenn Knecht Dr
- 705 S Grace Ave
- 314 Dunn Ave
- 905 1/2 Spann Ave
- 2710 E State Road 32
- 807 E Main St
- 822 N Walnut Hills
- 110 Woodlawn Place
- 111 N Pleasant Run
- 31 Pleasant Run
- 153 N Pleasant Run
- 138 N Pleasant Run
- 108 N Pleasant Run
- 75 N Pleasant Run
- 148 N Pleasant Run
- 187 N Pleasant Run
- 90 N Pleasant Run
- 170 N Pleasant Run
- 61 N Pleasant Run
- 139 N Center Ln
- 198 N Pleasant Run
- 109 N Center Ln
- 139 N Center Ln
- 201 N Pleasant Run
- 1965 E Placid Place
- 149 N Center Ln
- 99 N Center Ln
- 169 N Center Ln