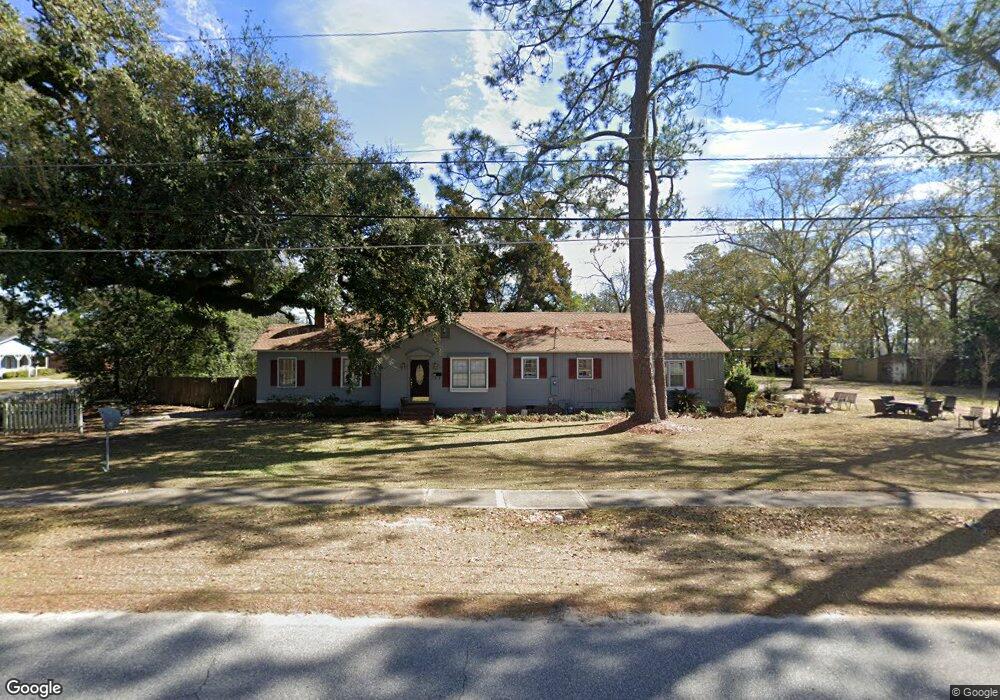
125 N Scott St Camilla, GA 31730
Estimated Value: $150,130 - $172,000
--
Bed
1
Bath
2,067
Sq Ft
$79/Sq Ft
Est. Value
About This Home
This home is located at 125 N Scott St, Camilla, GA 31730 and is currently estimated at $163,033, approximately $78 per square foot. 125 N Scott St is a home located in Mitchell County with nearby schools including Mitchell County Primary School, Mitchell County Elementary School, and Mitchell County Middle School.
Ownership History
Date
Name
Owned For
Owner Type
Purchase Details
Closed on
Jan 1, 2019
Sold by
Mendez Francisco
Bought by
Knight Melondy M
Current Estimated Value
Purchase Details
Closed on
Sep 17, 2014
Sold by
Knight Christine D
Bought by
Knight Melondy M and Mendez Francisco M
Home Financials for this Owner
Home Financials are based on the most recent Mortgage that was taken out on this home.
Original Mortgage
$70,499
Interest Rate
4.5%
Mortgage Type
FHA
Create a Home Valuation Report for This Property
The Home Valuation Report is an in-depth analysis detailing your home's value as well as a comparison with similar homes in the area
Home Values in the Area
Average Home Value in this Area
Purchase History
| Date | Buyer | Sale Price | Title Company |
|---|---|---|---|
| Knight Melondy M | -- | -- | |
| Knight Melondy M | $71,800 | -- |
Source: Public Records
Mortgage History
| Date | Status | Borrower | Loan Amount |
|---|---|---|---|
| Previous Owner | Knight Melondy M | $70,499 |
Source: Public Records
Tax History Compared to Growth
Tax History
| Year | Tax Paid | Tax Assessment Tax Assessment Total Assessment is a certain percentage of the fair market value that is determined by local assessors to be the total taxable value of land and additions on the property. | Land | Improvement |
|---|---|---|---|---|
| 2024 | $1,950 | $51,348 | $4,800 | $46,548 |
| 2023 | $2,126 | $51,348 | $4,800 | $46,548 |
| 2022 | $1,573 | $37,428 | $4,800 | $32,628 |
| 2021 | $1,346 | $33,668 | $4,800 | $28,868 |
| 2020 | $1,346 | $33,668 | $4,800 | $28,868 |
| 2019 | $1,340 | $33,668 | $4,800 | $28,868 |
| 2018 | $1,469 | $33,668 | $4,800 | $28,868 |
| 2017 | $1,236 | $30,266 | $4,800 | $25,466 |
| 2016 | $1,291 | $30,266 | $4,800 | $25,466 |
| 2015 | $1,291 | $30,266 | $4,800 | $25,466 |
| 2014 | $1,291 | $30,266 | $4,800 | $25,466 |
| 2013 | $1,291 | $30,266 | $4,800 | $25,466 |
Source: Public Records
Map
Nearby Homes