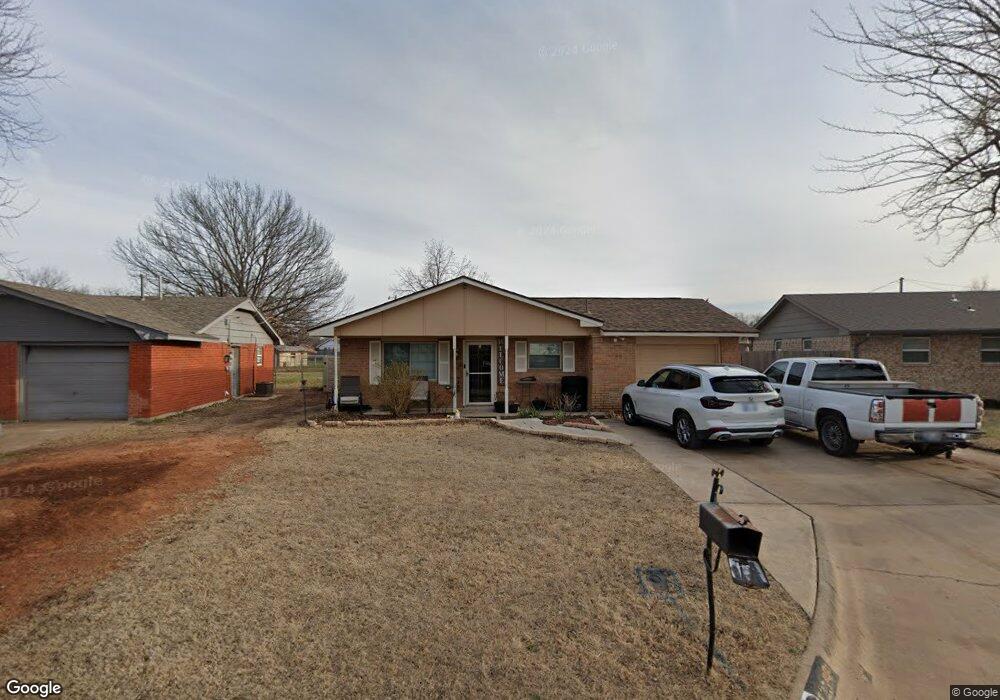
125 NE Dunlop St Lawton, OK 73507
Estimated Value: $134,000 - $152,000
3
Beds
2
Baths
1,622
Sq Ft
$87/Sq Ft
Est. Value
About This Home
This home is located at 125 NE Dunlop St, Lawton, OK 73507 and is currently estimated at $140,997, approximately $86 per square foot. 125 NE Dunlop St is a home located in Comanche County with nearby schools including Pioneer Park Elementary School, MacArthur Middle School, and MacArthur High School.
Ownership History
Date
Name
Owned For
Owner Type
Purchase Details
Closed on
Feb 14, 2025
Sold by
Martin Carlus U and Hall Carlus U
Bought by
Hall Tom E
Current Estimated Value
Purchase Details
Closed on
Aug 11, 2020
Sold by
Hall Tom E and Hall Carlus U
Bought by
Hall Tom E and Hall Carlus U
Purchase Details
Closed on
Feb 21, 2006
Sold by
Hall Tom E and Hall Bessie Marle
Bought by
Hall Tom E
Home Financials for this Owner
Home Financials are based on the most recent Mortgage that was taken out on this home.
Original Mortgage
$85,000
Interest Rate
10.25%
Mortgage Type
Adjustable Rate Mortgage/ARM
Purchase Details
Closed on
Feb 8, 2006
Sold by
Hall Tom E and Hall Bessie Marie
Bought by
Hall Tom E
Home Financials for this Owner
Home Financials are based on the most recent Mortgage that was taken out on this home.
Original Mortgage
$85,000
Interest Rate
10.25%
Mortgage Type
Adjustable Rate Mortgage/ARM
Create a Home Valuation Report for This Property
The Home Valuation Report is an in-depth analysis detailing your home's value as well as a comparison with similar homes in the area
Home Values in the Area
Average Home Value in this Area
Purchase History
| Date | Buyer | Sale Price | Title Company |
|---|---|---|---|
| Hall Tom E | -- | None Listed On Document | |
| Hall Tom E | -- | None Listed On Document | |
| Hall Tom E | -- | None Available | |
| Hall Tom E | -- | -- | |
| Hall Tom E | -- | -- |
Source: Public Records
Mortgage History
| Date | Status | Borrower | Loan Amount |
|---|---|---|---|
| Previous Owner | Hall Tom E | $85,000 |
Source: Public Records
Tax History Compared to Growth
Tax History
| Year | Tax Paid | Tax Assessment Tax Assessment Total Assessment is a certain percentage of the fair market value that is determined by local assessors to be the total taxable value of land and additions on the property. | Land | Improvement |
|---|---|---|---|---|
| 2025 | -- | $12,053 | $2,378 | $9,675 |
| 2024 | -- | $12,052 | $2,369 | $9,683 |
| 2023 | $0 | $11,361 | $2,250 | $9,111 |
| 2022 | $0 | $11,030 | $2,250 | $8,780 |
| 2021 | $0 | $11,386 | $2,250 | $9,136 |
| 2020 | $0 | $11,054 | $2,250 | $8,804 |
| 2019 | $0 | $11,054 | $2,250 | $8,804 |
| 2018 | $0 | $12,538 | $2,250 | $10,288 |
| 2017 | $0 | $12,538 | $2,250 | $10,288 |
| 2016 | -- | $12,253 | $1,069 | $11,184 |
| 2015 | -- | $12,253 | $1,069 | $11,184 |
| 2014 | -- | $12,253 | $1,069 | $11,184 |
Source: Public Records
Map
Nearby Homes
- 125 NE Cimarron Trail
- 111 NE English St
- 109 NE English St
- 803 NE Turtle Dove Ln
- 908 NE Dove Ln
- 2905 NE Tortoise Dr
- 204 NW Mockingbird Rd
- 2604 NE Garden Ln
- 0 NE Rogers Ln
- 1004 NE Bob White Rd
- 418 NW Glendale Dr
- 513 NW Mission Blvd
- 605 NW Glendale Dr
- 1216 NW Carroll Dr
- 1205 NW Bessie Ave
- 1183 NW Ozmun Ave
- 1411 NW Ozmun Ave
- 2507 NE Heritage Creek Dr
- 1219 NW Williams Ave
- 1110 NW Irwin Ave
- 129 NE Dunlop St
- 127 NE Dunlop St
- 123 NE Dunlop St
- 131 NE Dunlop St
- 121 NE Dunlop St
- 122 NE Dunlop St
- 135 NE Dunlop St
- 125 NE English St
- 402 NE Dunlop St
- 123 NE English St
- 119 NE Dunlop St
- 133 NE Dunlop St
- 120 NE Dunlop St
- 134 NE Cimarron Trail
- 132 NE Cimarron Trail
- 137 NE Dunlop St
- 136 NE Cimarron Trail
- 506 NE Cimarron Cir
- 130 NE Cimarron Trail
- 130 NE English St