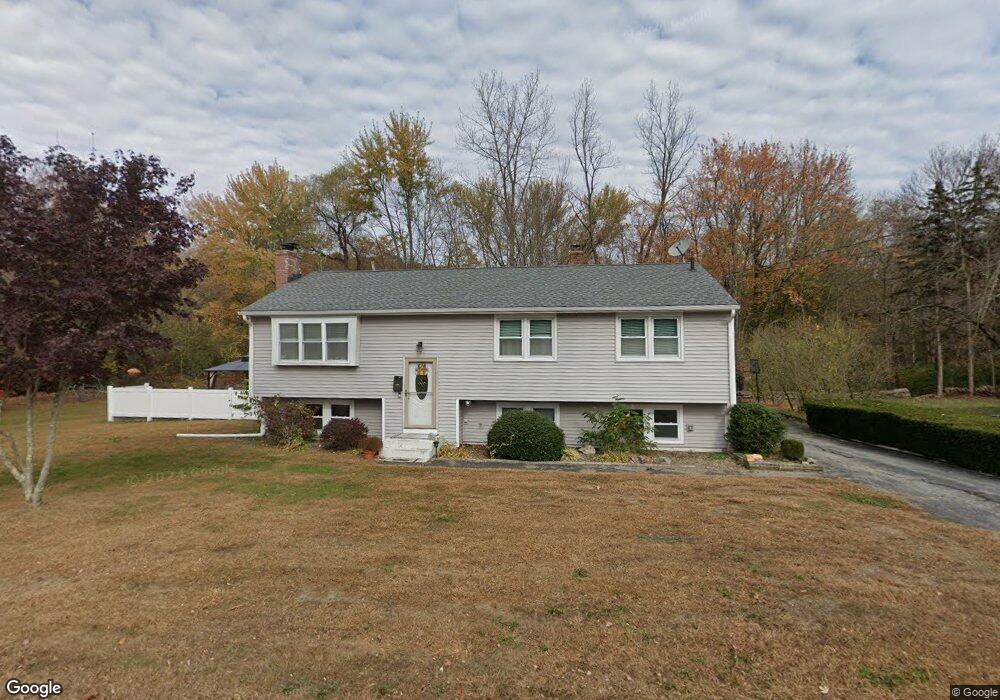
125 Newton St Norwich, CT 06360
Central Norwich NeighborhoodEstimated Value: $313,000 - $357,000
4
Beds
1
Bath
1,196
Sq Ft
$279/Sq Ft
Est. Value
About This Home
This home is located at 125 Newton St, Norwich, CT 06360 and is currently estimated at $333,343, approximately $278 per square foot. 125 Newton St is a home located in New London County with nearby schools including John B. Stanton Elementary School, Teachers' Memorial Global Studies Magnet Middle, and Montessori Discovery School.
Ownership History
Date
Name
Owned For
Owner Type
Purchase Details
Closed on
Nov 19, 2021
Sold by
Charles Fred W
Bought by
Charles Fred W and Charles Christina
Current Estimated Value
Home Financials for this Owner
Home Financials are based on the most recent Mortgage that was taken out on this home.
Original Mortgage
$180,000
Interest Rate
3.12%
Mortgage Type
New Conventional
Purchase Details
Closed on
Jun 13, 2012
Sold by
Sautter Brenda L
Bought by
Charles Fred W
Home Financials for this Owner
Home Financials are based on the most recent Mortgage that was taken out on this home.
Original Mortgage
$174,750
Interest Rate
3.25%
Mortgage Type
FHA
Create a Home Valuation Report for This Property
The Home Valuation Report is an in-depth analysis detailing your home's value as well as a comparison with similar homes in the area
Home Values in the Area
Average Home Value in this Area
Purchase History
| Date | Buyer | Sale Price | Title Company |
|---|---|---|---|
| Charles Fred W | -- | None Available | |
| Charles Fred W | -- | None Available | |
| Charles Fred W | -- | None Available | |
| Charles Fred W | $178,000 | -- | |
| Charles Fred W | $178,000 | -- |
Source: Public Records
Mortgage History
| Date | Status | Borrower | Loan Amount |
|---|---|---|---|
| Previous Owner | Charles Fred W | $180,000 | |
| Previous Owner | Charles Fred W | $174,750 | |
| Previous Owner | Charles Fred W | $14,900 |
Source: Public Records
Tax History Compared to Growth
Tax History
| Year | Tax Paid | Tax Assessment Tax Assessment Total Assessment is a certain percentage of the fair market value that is determined by local assessors to be the total taxable value of land and additions on the property. | Land | Improvement |
|---|---|---|---|---|
| 2025 | $6,196 | $178,000 | $47,800 | $130,200 |
| 2024 | $5,919 | $178,000 | $47,800 | $130,200 |
| 2023 | $4,398 | $105,100 | $27,700 | $77,400 |
| 2022 | $4,433 | $105,100 | $27,700 | $77,400 |
| 2021 | $4,362 | $103,000 | $27,700 | $75,300 |
| 2020 | $4,365 | $103,000 | $27,700 | $75,300 |
| 2019 | $4,186 | $103,000 | $27,700 | $75,300 |
| 2018 | $3,980 | $96,000 | $23,800 | $72,200 |
| 2017 | $3,904 | $96,000 | $23,800 | $72,200 |
| 2016 | $4,002 | $96,000 | $23,800 | $72,200 |
| 2015 | $3,973 | $96,000 | $23,800 | $72,200 |
| 2014 | $3,748 | $96,000 | $23,800 | $72,200 |
Source: Public Records
Map
Nearby Homes