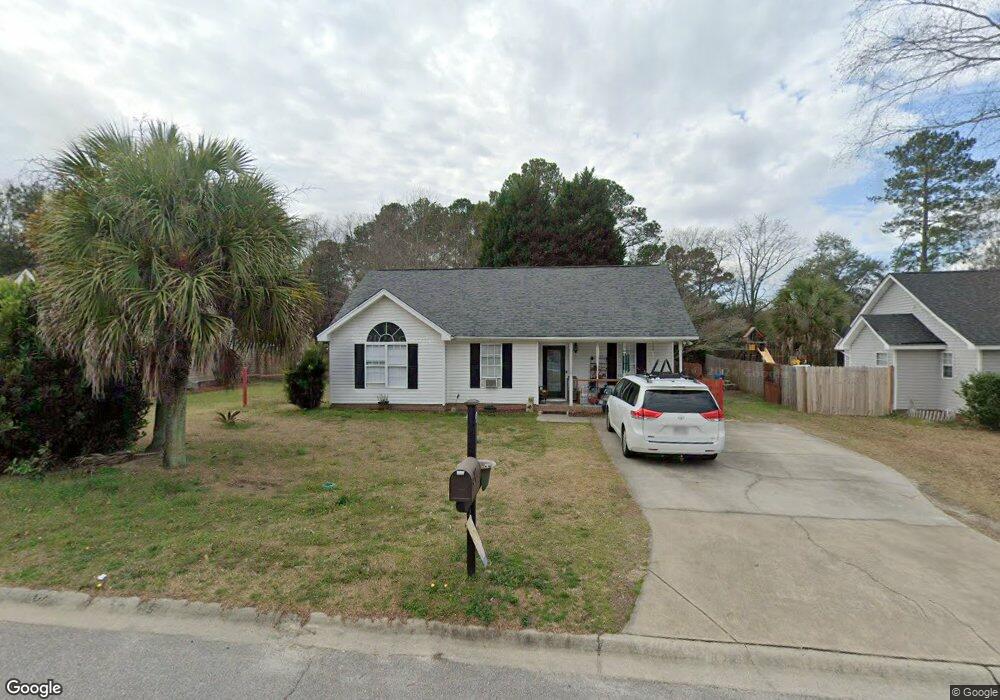
125 Pear Ct Lexington, SC 29073
Estimated Value: $206,000 - $220,000
3
Beds
2
Baths
1,200
Sq Ft
$176/Sq Ft
Est. Value
About This Home
This home is located at 125 Pear Ct, Lexington, SC 29073 and is currently estimated at $211,781, approximately $176 per square foot. 125 Pear Ct is a home located in Lexington County with nearby schools including Riverbank Elementary, Northside Middle, and Brookland-Cayce High School.
Ownership History
Date
Name
Owned For
Owner Type
Purchase Details
Closed on
Jun 5, 2017
Sold by
Shuai Chen
Bought by
Davis Jessica and Davis Hugh
Current Estimated Value
Home Financials for this Owner
Home Financials are based on the most recent Mortgage that was taken out on this home.
Original Mortgage
$6,000
Outstanding Balance
$4,980
Interest Rate
3.94%
Estimated Equity
$206,801
Purchase Details
Closed on
Jan 13, 2017
Sold by
Deutsche Bank Trust Company
Bought by
Chen Shuai
Purchase Details
Closed on
Jun 1, 2016
Sold by
Deutsche Bank Trust Company Americas and Orr Matthew A
Bought by
Deutsche Bank Trust Company Americas
Purchase Details
Closed on
Mar 18, 2005
Sold by
Stewart Mark A
Bought by
Orr Albert
Home Financials for this Owner
Home Financials are based on the most recent Mortgage that was taken out on this home.
Original Mortgage
$10,100
Interest Rate
5.11%
Mortgage Type
Stand Alone Second
Create a Home Valuation Report for This Property
The Home Valuation Report is an in-depth analysis detailing your home's value as well as a comparison with similar homes in the area
Home Values in the Area
Average Home Value in this Area
Purchase History
| Date | Buyer | Sale Price | Title Company |
|---|---|---|---|
| Davis Jessica | $115,000 | -- | |
| Chen Shuai | $70,314 | None Available | |
| Deutsche Bank Trust Company Americas | $30,000 | None Available | |
| Orr Albert | $101,000 | -- |
Source: Public Records
Mortgage History
| Date | Status | Borrower | Loan Amount |
|---|---|---|---|
| Open | Davis Jessica | $6,000 | |
| Open | Davis Jessica | $109,250 | |
| Closed | Davis Jessica | -- | |
| Previous Owner | Orr Albert | $10,100 | |
| Previous Owner | Orr Albert | $80,800 |
Source: Public Records
Tax History Compared to Growth
Tax History
| Year | Tax Paid | Tax Assessment Tax Assessment Total Assessment is a certain percentage of the fair market value that is determined by local assessors to be the total taxable value of land and additions on the property. | Land | Improvement |
|---|---|---|---|---|
| 2024 | $664 | $4,687 | $1,400 | $3,287 |
| 2023 | $664 | $4,687 | $1,400 | $3,287 |
| 2022 | $665 | $4,687 | $1,400 | $3,287 |
| 2020 | $662 | $4,687 | $1,400 | $3,287 |
| 2019 | $662 | $4,600 | $1,200 | $3,400 |
| 2018 | $672 | $4,600 | $1,200 | $3,400 |
| 2017 | $608 | $4,329 | $1,200 | $3,129 |
| 2016 | $625 | $4,329 | $1,200 | $3,129 |
| 2014 | $131 | $4,331 | $1,052 | $3,279 |
| 2013 | -- | $4,330 | $1,050 | $3,280 |
Source: Public Records
Map
Nearby Homes
- 229 Laurel Meadows Dr
- 509 Chisolm Way
- 311 Duchess Trail
- 187 Golden Pond Dr
- 38 Shadowfield Dr
- 108 Wismar St
- 114 Wismar St
- 105 Agape Village Ct
- 0 Mossborough Dr
- 205 Mansfield Cir
- 213 Mansfield Cir
- 149 Mansfield Cir
- 538 Blue Jay Way
- Saluda Plan at Birdhaven
- Riviera Plan at Birdhaven
- Insha Plan at Birdhaven
- Nile Plan at Birdhaven
- 122 Mansfield Cir
- 238 Cromer Rd
- 542 Blue Jay Way