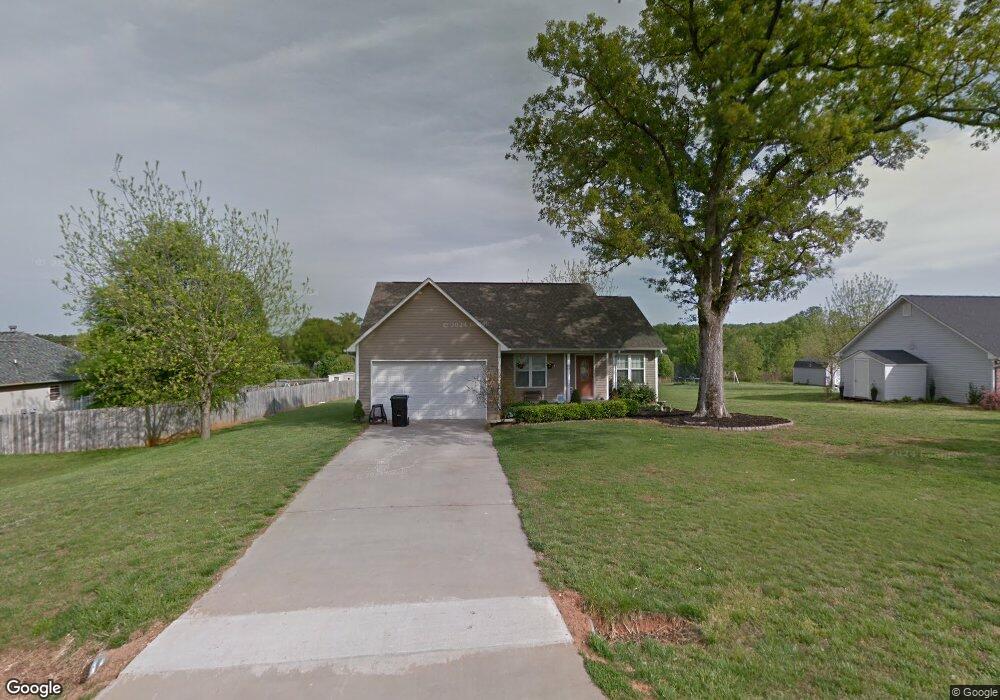
125 Planters Row Rd Iron Station, NC 28080
Estimated Value: $303,819 - $395,000
3
Beds
2
Baths
1,299
Sq Ft
$263/Sq Ft
Est. Value
About This Home
This home is located at 125 Planters Row Rd, Iron Station, NC 28080 and is currently estimated at $341,455, approximately $262 per square foot. 125 Planters Row Rd is a home located in Lincoln County with nearby schools including St. James Elementary School, East Lincoln Middle School, and East Lincoln High School.
Ownership History
Date
Name
Owned For
Owner Type
Purchase Details
Closed on
May 13, 2009
Sold by
Morris John Randall and Morris Adrienne Thomson
Bought by
Morris John Randall and Morris Adrienne Thomson
Current Estimated Value
Home Financials for this Owner
Home Financials are based on the most recent Mortgage that was taken out on this home.
Original Mortgage
$137,362
Outstanding Balance
$86,975
Interest Rate
4.89%
Mortgage Type
FHA
Estimated Equity
$254,480
Purchase Details
Closed on
Aug 23, 2005
Sold by
Gibson And Gibson Inc
Bought by
Morris John Randall and Morris Adrienne Thomason
Home Financials for this Owner
Home Financials are based on the most recent Mortgage that was taken out on this home.
Original Mortgage
$108,800
Interest Rate
6.62%
Mortgage Type
Adjustable Rate Mortgage/ARM
Create a Home Valuation Report for This Property
The Home Valuation Report is an in-depth analysis detailing your home's value as well as a comparison with similar homes in the area
Home Values in the Area
Average Home Value in this Area
Purchase History
| Date | Buyer | Sale Price | Title Company |
|---|---|---|---|
| Morris John Randall | -- | None Available | |
| Morris John Randall | $136,000 | None Available |
Source: Public Records
Mortgage History
| Date | Status | Borrower | Loan Amount |
|---|---|---|---|
| Open | Morris John Randall | $137,362 | |
| Closed | Morris John Randall | $108,800 | |
| Closed | Morris John Randall | $27,200 |
Source: Public Records
Tax History Compared to Growth
Tax History
| Year | Tax Paid | Tax Assessment Tax Assessment Total Assessment is a certain percentage of the fair market value that is determined by local assessors to be the total taxable value of land and additions on the property. | Land | Improvement |
|---|---|---|---|---|
| 2025 | $1,700 | $254,046 | $36,000 | $218,046 |
| 2024 | $1,660 | $254,046 | $36,000 | $218,046 |
| 2023 | $1,649 | $254,046 | $36,000 | $218,046 |
| 2022 | $1,321 | $163,205 | $29,000 | $134,205 |
| 2021 | $1,321 | $163,205 | $29,000 | $134,205 |
| 2020 | $1,173 | $163,205 | $29,000 | $134,205 |
| 2019 | $1,136 | $163,205 | $29,000 | $134,205 |
| 2018 | $1,071 | $136,997 | $27,000 | $109,997 |
| 2017 | $970 | $136,997 | $27,000 | $109,997 |
| 2016 | $970 | $136,997 | $27,000 | $109,997 |
| 2015 | $1,037 | $136,997 | $27,000 | $109,997 |
| 2014 | $1,032 | $136,997 | $27,000 | $109,997 |
Source: Public Records
Map
Nearby Homes
- 29 Planters Row Rd Unit 29
- 27 Planters Row Rd Unit 27
- 28 Planters Row Rd Unit 28
- 26 Planters Row Rd Unit 26
- 34 Planters Row Rd Unit 34
- 32 Planters Row Rd Unit 32
- 25 Planters Row Rd
- 22 Planters Row Rd
- 0 Dalmatian St Unit CAR4157812
- 601 Lhasa Apso Ln
- 0 Lhasa Apso Ln Unit CAR4157960
- 0 Lhasa Apso Ln Unit CAR4157956
- 5756 Dalmatian St
- 0 Great Dane Ave Unit CAR4157929
- 5748 Dalmatian St
- 0000 Chase Dr Unit 3
- 5716 Dalmatian St
- Lot 156 Cocker Spaniel Ct
- 130 Rapids Run Trail
- 812 Trinity Ln
- 147 Planters Row Rd
- 117 Planters Row Rd
- 270 Planters Row Rd
- 126 Planters Row Rd
- 155 Planters Row Rd
- 144 Planters Row Rd
- 116 Planters Row Rd
- 116 Planters Row Rd Unit 5
- 163 Planters Row Rd
- 150 Planters Row Rd
- 106 Planters Row Rd
- 9 Planters Row Rd Unit 9
- 36 Planters Row Rd Unit 36
- 35 Planters Row Rd Unit 35
- 48 Planters Row Rd Unit 48
- 50 Planters Row Rd Unit 50
- 154 Planters Row Rd
- 175 Planters Row Rd
- 4192 Nc 73 Hwy
- 172 Planters Row Rd