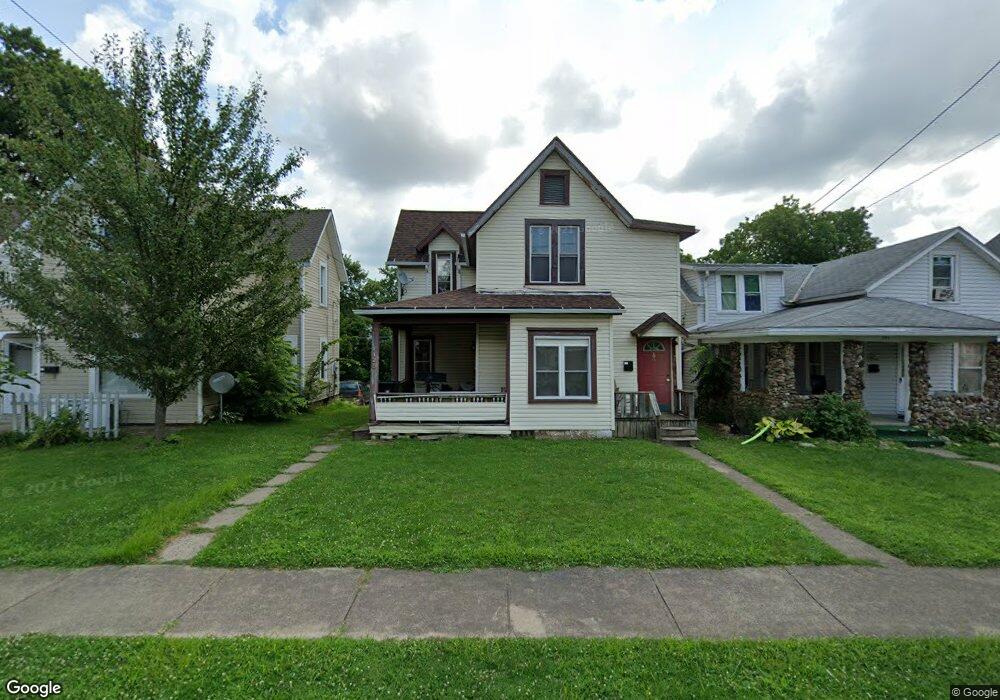
125 Poplar St Mansfield, OH 44903
Estimated Value: $64,357 - $123,000
4
Beds
2
Baths
1,828
Sq Ft
$55/Sq Ft
Est. Value
About This Home
This home is located at 125 Poplar St, Mansfield, OH 44903 and is currently estimated at $101,089, approximately $55 per square foot. 125 Poplar St is a home located in Richland County with nearby schools including Goal Digital Academy, St. Peter's High School/Junior High, and St. Peter's Elementary/Montessori School.
Ownership History
Date
Name
Owned For
Owner Type
Purchase Details
Closed on
Sep 19, 2013
Sold by
Webster James L and Webster Beth Ann
Bought by
Melton Melvin L
Current Estimated Value
Purchase Details
Closed on
Mar 31, 2000
Sold by
Schroeder Travis J
Bought by
Webster James L and Webster Beth A
Home Financials for this Owner
Home Financials are based on the most recent Mortgage that was taken out on this home.
Original Mortgage
$168,500
Interest Rate
9.5%
Mortgage Type
New Conventional
Purchase Details
Closed on
Nov 7, 1997
Sold by
Weber Paul L
Bought by
Schroeder Travis J
Home Financials for this Owner
Home Financials are based on the most recent Mortgage that was taken out on this home.
Original Mortgage
$32,800
Interest Rate
7.42%
Mortgage Type
New Conventional
Purchase Details
Closed on
Mar 1, 1987
Create a Home Valuation Report for This Property
The Home Valuation Report is an in-depth analysis detailing your home's value as well as a comparison with similar homes in the area
Home Values in the Area
Average Home Value in this Area
Purchase History
| Date | Buyer | Sale Price | Title Company |
|---|---|---|---|
| Melton Melvin L | $3,000 | None Available | |
| Webster James L | $40,000 | -- | |
| Schroeder Travis J | $40,000 | -- | |
| -- | $9,900 | -- |
Source: Public Records
Mortgage History
| Date | Status | Borrower | Loan Amount |
|---|---|---|---|
| Previous Owner | Webster James L | $168,500 | |
| Previous Owner | Schroeder Travis J | $32,800 |
Source: Public Records
Tax History Compared to Growth
Tax History
| Year | Tax Paid | Tax Assessment Tax Assessment Total Assessment is a certain percentage of the fair market value that is determined by local assessors to be the total taxable value of land and additions on the property. | Land | Improvement |
|---|---|---|---|---|
| 2024 | $345 | $7,200 | $3,070 | $4,130 |
| 2023 | $345 | $7,200 | $3,070 | $4,130 |
| 2022 | $302 | $5,280 | $2,520 | $2,760 |
| 2021 | $304 | $5,280 | $2,520 | $2,760 |
| 2020 | $745 | $12,660 | $2,520 | $10,140 |
| 2019 | $826 | $12,660 | $2,520 | $10,140 |
| 2018 | $815 | $12,660 | $2,520 | $10,140 |
| 2017 | $679 | $12,660 | $2,520 | $10,140 |
| 2016 | $564 | $8,740 | $2,800 | $5,940 |
| 2015 | $539 | $8,740 | $2,800 | $5,940 |
| 2014 | $532 | $8,740 | $2,800 | $5,940 |
| 2012 | $396 | $8,740 | $2,800 | $5,940 |
Source: Public Records
Map
Nearby Homes
- 114 Vennum Ave
- 450 Glessner Ave
- 118 Lind Ave
- 76 Bartley Ave
- 88 Sherman Ave
- 37 Baldwin Ave
- 38 Baldwin Ave
- 126 Dawson Ave
- 135 Wood St
- 470 Woodward Ave
- 257 Wood St
- 71 Glenwood Blvd
- 24 Stewart Ave S
- 131 Sturges Ave
- 21 Glenwood Blvd
- 118 Parkwood Blvd
- 41 Parkwood Blvd
- 80 Rowland Ave
- 611 Park Ave W
- 406 Sherman Place