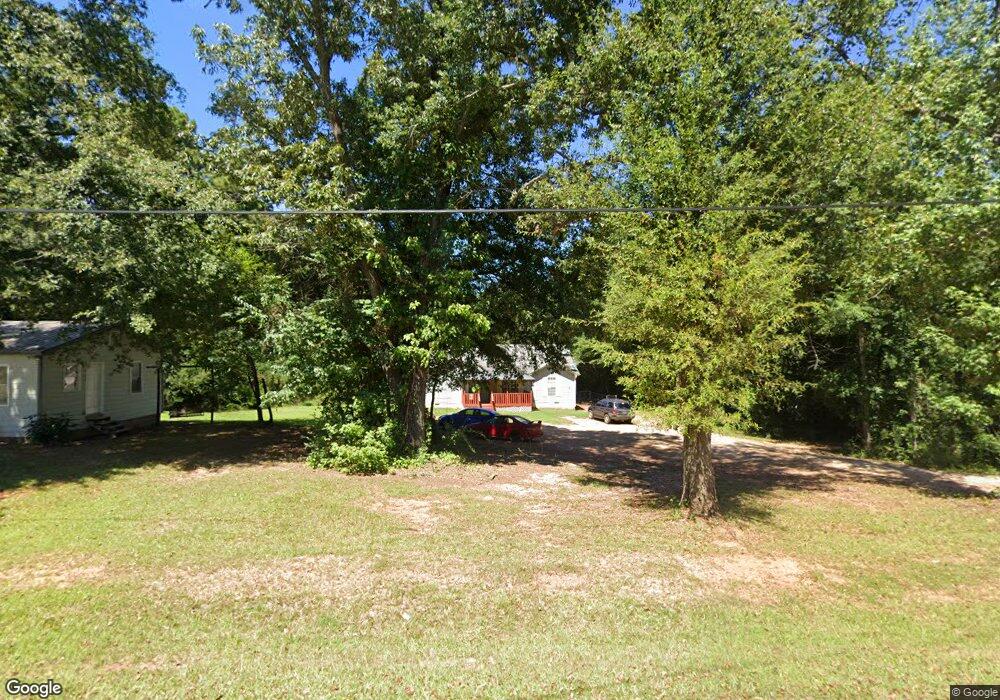
125 Priscilla Dr Lagrange, GA 30241
Estimated Value: $172,000 - $199,028
3
Beds
2
Baths
1,564
Sq Ft
$119/Sq Ft
Est. Value
About This Home
This home is located at 125 Priscilla Dr, Lagrange, GA 30241 and is currently estimated at $186,007, approximately $118 per square foot. 125 Priscilla Dr is a home located in Troup County with nearby schools including Franklin Forest Elementary School, Hillcrest Elementary School, and Hollis Hand Elementary School.
Ownership History
Date
Name
Owned For
Owner Type
Purchase Details
Closed on
Apr 18, 2008
Sold by
Jpmorgan Chase Bank
Bought by
Christopher East
Current Estimated Value
Home Financials for this Owner
Home Financials are based on the most recent Mortgage that was taken out on this home.
Original Mortgage
$71,477
Outstanding Balance
$44,360
Interest Rate
5.84%
Mortgage Type
New Conventional
Estimated Equity
$141,647
Purchase Details
Closed on
Feb 5, 2008
Sold by
Hatfield Thomas
Bought by
Jpmorgan Chase Bank
Purchase Details
Closed on
Feb 15, 1994
Sold by
Karen Denise Bradley
Bought by
Hatfield Thomas
Purchase Details
Closed on
Feb 1, 1994
Sold by
Karen Denise Bradley
Bought by
Karen Denise Bradley
Purchase Details
Closed on
Aug 26, 1980
Sold by
Pitts W L
Bought by
Karen Denise Bradley
Create a Home Valuation Report for This Property
The Home Valuation Report is an in-depth analysis detailing your home's value as well as a comparison with similar homes in the area
Purchase History
We collect this data history from publicly available records. To have your information removed, we recommend requesting removal directly through your county’s website.
| Date | Buyer | Sale Price | Title Company |
|---|---|---|---|
| Christopher East | $70,100 | -- | |
| Jpmorgan Chase Bank | $95,000 | -- | |
| Hatfield Thomas | -- | -- | |
| Karen Denise Bradley | -- | -- | |
| Karen Denise Bradley | $12,500 | -- |
Source: Public Records
Mortgage History
We collect this data history from publicly available records. To have your information removed, we recommend requesting removal directly through your county’s website.
| Date | Status | Borrower | Loan Amount |
|---|---|---|---|
| Open | Christopher East | $71,477 |
Source: Public Records
Tax History
| Year | Tax Paid | Tax Assessment Tax Assessment Total Assessment is a certain percentage of the fair market value that is determined by local assessors to be the total taxable value of land and additions on the property. | Land | Improvement |
|---|---|---|---|---|
| 2025 | $1,746 | $64,028 | $2,520 | $61,508 |
| 2024 | $1,483 | $54,388 | $2,520 | $51,868 |
| 2023 | $1,424 | $52,204 | $2,520 | $49,684 |
| 2022 | $1,378 | $49,364 | $2,520 | $46,844 |
| 2021 | $1,497 | $49,644 | $2,520 | $47,124 |
| 2020 | $1,166 | $38,644 | $2,520 | $36,124 |
| 2019 | $1,101 | $38,500 | $2,520 | $35,980 |
| 2018 | $999 | $35,100 | $2,420 | $32,680 |
| 2017 | $999 | $35,100 | $2,420 | $32,680 |
| 2016 | $974 | $34,277 | $2,420 | $31,857 |
| 2015 | $976 | $34,277 | $2,420 | $31,857 |
| 2014 | $927 | $32,600 | $2,420 | $30,180 |
| 2013 | -- | $34,786 | $2,420 | $32,366 |
Source: Public Records
Map
Nearby Homes
- 134 S Page St
- 519 Tradition Place
- 517 Tradition Place
- 1351 New Franklin Rd
- 129 Celebration Blvd
- 115 Daniel Ct
- 133 Alton Dr
- 112 Celebration Blvd
- 124 Melrose Dr
- 100 Deer Creek Dr
- 102 Beech Creek Dr
- 1199 Youngs Mill Rd
- 806 New Franklin Rd
- 1333 Mooty Bridge Rd Unit 2
- 610 Youngs Mill Rd
- 172 Merrybrook Dr
- 127 Ashling Dr
- 226 Hearthstone Dr
- 91 Richmond Dr
- 148 Wisteria Ridge Terrace
- 115 Priscilla Dr
- 101 Priscilla Dr
- 118 Priscilla Dr
- 132 Priscilla Dr
- 91 Priscilla Dr
- 91 Priscilla Dr Unit A
- 144 Priscilla Dr
- 156 Chase Rd
- 79 Priscilla Dr
- 162 Priscilla Dr
- 120 Chase Rd
- 175 Priscilla Dr
- 135 Chase Rd
- 19 Priscilla Dr
- 49 Priscilla Dr
- 37 Priscilla Dr
- 72 Priscilla Dr
- 187 Priscilla Dr
- 190 Priscilla Dr
- 179 Chase Rd
Your Personal Tour Guide
Ask me questions while you tour the home.