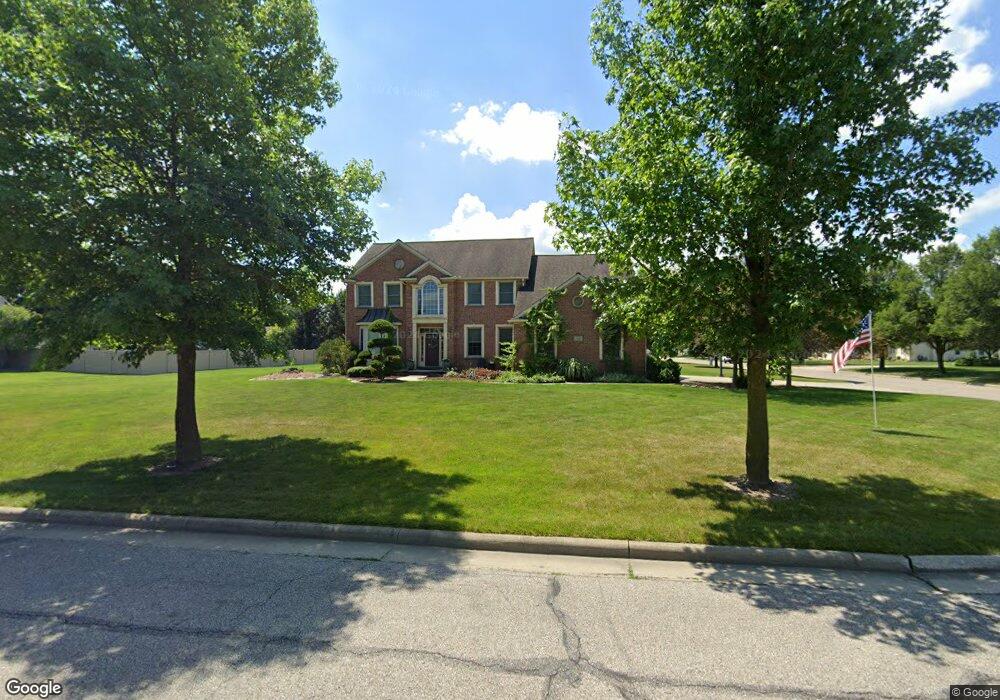
125 Quail Run Archbold, OH 43502
Estimated Value: $311,000 - $481,000
4
Beds
3
Baths
2,942
Sq Ft
$142/Sq Ft
Est. Value
About This Home
This home is located at 125 Quail Run, Archbold, OH 43502 and is currently estimated at $418,128, approximately $142 per square foot. 125 Quail Run is a home located in Fulton County with nearby schools including Archbold Elementary School, Archbold Middle School, and Archbold High School.
Ownership History
Date
Name
Owned For
Owner Type
Purchase Details
Closed on
Sep 17, 2007
Sold by
Farmers & Merchants State Bank
Bought by
Miller Zachary L and Miller Monica M
Current Estimated Value
Home Financials for this Owner
Home Financials are based on the most recent Mortgage that was taken out on this home.
Original Mortgage
$270,000
Outstanding Balance
$171,471
Interest Rate
6.63%
Mortgage Type
Purchase Money Mortgage
Estimated Equity
$246,657
Purchase Details
Closed on
Apr 5, 2006
Sold by
Hutchins Alan L and Hutchins Candy J
Bought by
Farmers & Merchants State Bank
Purchase Details
Closed on
Oct 3, 1997
Sold by
Roth Stephen D
Bought by
Hutchins Alan and Hutchins Candy
Home Financials for this Owner
Home Financials are based on the most recent Mortgage that was taken out on this home.
Original Mortgage
$27,753
Interest Rate
7.54%
Mortgage Type
New Conventional
Purchase Details
Closed on
Jan 1, 1990
Bought by
Roth Stephen D and Roth Becky M
Create a Home Valuation Report for This Property
The Home Valuation Report is an in-depth analysis detailing your home's value as well as a comparison with similar homes in the area
Home Values in the Area
Average Home Value in this Area
Purchase History
| Date | Buyer | Sale Price | Title Company |
|---|---|---|---|
| Miller Zachary L | $270,000 | None Available | |
| Farmers & Merchants State Bank | -- | None Available | |
| Hutchins Alan | $27,753 | -- | |
| Roth Stephen D | -- | -- |
Source: Public Records
Mortgage History
| Date | Status | Borrower | Loan Amount |
|---|---|---|---|
| Open | Miller Zachary L | $270,000 | |
| Previous Owner | Hutchins Alan | $27,753 |
Source: Public Records
Tax History Compared to Growth
Tax History
| Year | Tax Paid | Tax Assessment Tax Assessment Total Assessment is a certain percentage of the fair market value that is determined by local assessors to be the total taxable value of land and additions on the property. | Land | Improvement |
|---|---|---|---|---|
| 2024 | $7,255 | $140,420 | $15,400 | $125,020 |
| 2023 | $7,255 | $140,420 | $15,400 | $125,020 |
| 2022 | $5,712 | $117,050 | $12,850 | $104,200 |
| 2021 | $5,719 | $117,050 | $12,850 | $104,200 |
| 2020 | $5,692 | $117,050 | $12,850 | $104,200 |
| 2019 | $4,791 | $93,980 | $12,850 | $81,130 |
| 2018 | $4,360 | $93,980 | $12,850 | $81,130 |
| 2017 | $4,237 | $93,980 | $12,850 | $81,130 |
| 2016 | $4,371 | $90,030 | $12,850 | $77,180 |
| 2015 | $3,829 | $90,030 | $12,850 | $77,180 |
| 2014 | $3,936 | $90,030 | $12,850 | $77,180 |
| 2013 | $4,049 | $88,270 | $13,090 | $75,180 |
Source: Public Records
Map
Nearby Homes
- 433 Primrose Ln
- 552 Quail Run
- 301 N Pointe Dr
- 404 Walnut St
- 300 Degroff Ave
- 203 E Williams St
- 804 Murbach St
- 307 Middle St
- 24218 State Route 2
- 0 Lafayette St
- 0 S Defiance St
- 200 Burke St
- 112 Sylvanus St
- 209 Hawthorn Dr
- 7170 County Road 23
- 3063 County Road 26-2
- 0 County Road F
- 5445 County Road 19
- 22018 County Road F
- 23161 County Road Jk