
Seller's Agent in 2025
Pam MacPherson
@ Properties
(847) 508-8048
3 in this area
366 Total Sales
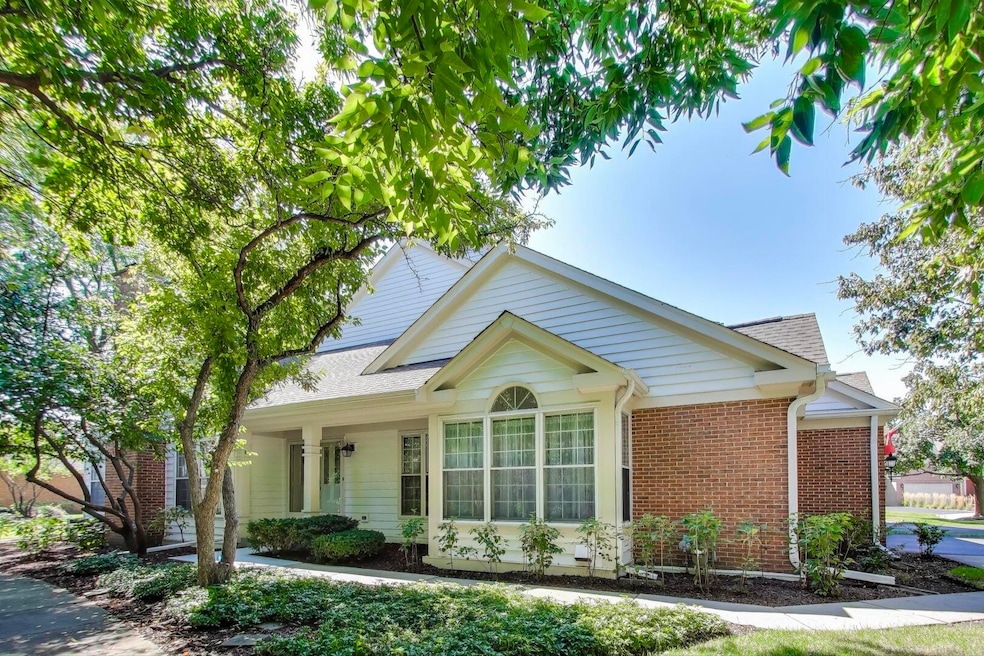
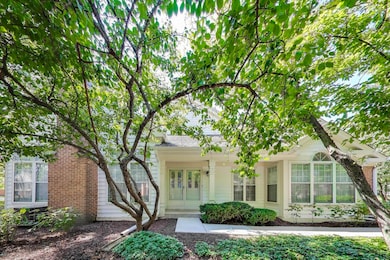
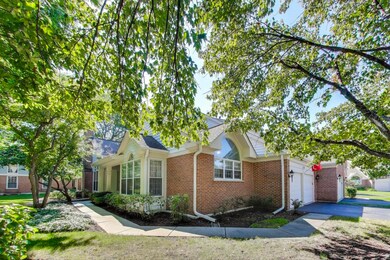
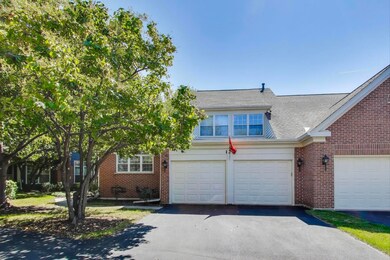
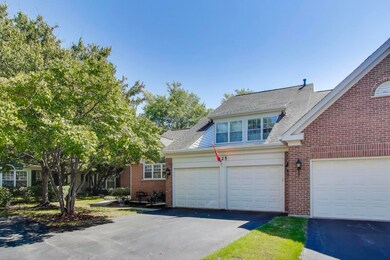
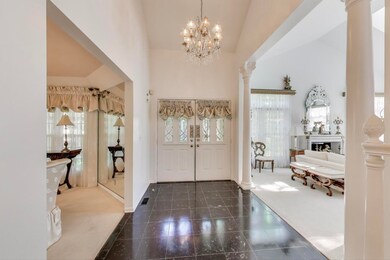
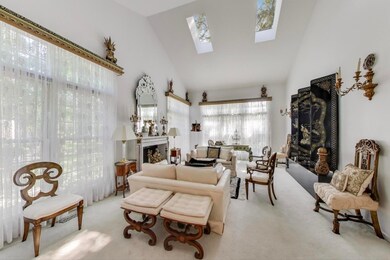
Welcome home to this 1st Floor Primary END-UNIT Townhome in coveted Princeton Village! This customized Dorchester model is in an ideal interior location within this beautiful gated community at the end of a private cul-de-sac just steps to walking paths and the pool and clubhouse. These original owners thoughtfully upgraded every inch of this unit with dental moldings, marble fireplace surrounds, elevated millwork, and custom built ins. On your first floor, be wowed by the 2 story living room with marble surround gas fireplace, generous formal dining room and eat in kitchen which is ready for your design ideas. The first floor also features a 2 car attached garage, laundry and of course your 1st floor primary with 2 large walk in closets, large ensuite bath with dual vanities, as well as a library/office with gorgeous views of your southern facing green space and patio. Upstairs you will find a full bath and 2 additional bedrooms one of which boasts a fairytale inspired built in canopy bed. In your wonderful entertaining basement a surprise feature awaits you with a Walt Disney artist custom mural making the basement a joyful playground for children, grandchildren and adults alike.
Last Agent to Sell the Property
@properties Christie's International Real Estate License #475166770 Listed on: 09/12/2025
Last Buyer's Agent
@properties Christie's International Real Estate License #475135790
| Date | Type | Sale Price | Title Company |
|---|---|---|---|
| Deed | -- | None Listed On Document | |
| Interfamily Deed Transfer | -- | -- | |
| Warranty Deed | $370,000 | Rei Title Guaranty |
| Date | Status | Loan Amount | Loan Type |
|---|---|---|---|
| Previous Owner | $40,000 | No Value Available |
| Date | Event | Price | List to Sale | Price per Sq Ft |
|---|---|---|---|---|
| 11/17/2025 11/17/25 | Sold | $700,000 | 0.0% | $258 / Sq Ft |
| 09/22/2025 09/22/25 | For Sale | $700,000 | -- | $258 / Sq Ft |
| 09/19/2025 09/19/25 | Pending | -- | -- | -- |
| Year | Tax Paid | Tax Assessment Tax Assessment Total Assessment is a certain percentage of the fair market value that is determined by local assessors to be the total taxable value of land and additions on the property. | Land | Improvement |
|---|---|---|---|---|
| 2024 | $9,008 | $44,852 | $11,806 | $33,046 |
| 2023 | $8,740 | $44,852 | $11,806 | $33,046 |
| 2022 | $8,740 | $44,852 | $11,806 | $33,046 |
| 2021 | $8,748 | $40,183 | $9,908 | $30,275 |
| 2020 | $8,734 | $40,183 | $9,908 | $30,275 |
| 2019 | $8,418 | $44,379 | $9,908 | $34,471 |
| 2018 | $9,106 | $43,813 | $8,643 | $35,170 |
| 2017 | $8,949 | $43,813 | $8,643 | $35,170 |
| 2016 | $8,525 | $43,813 | $8,643 | $35,170 |
| 2015 | $7,079 | $33,883 | $6,957 | $26,926 |
| 2014 | $6,971 | $33,883 | $6,957 | $26,926 |
| 2013 | $7,907 | $33,883 | $6,957 | $26,926 |
Seller's Agent in 2025
Pam MacPherson
@ Properties
(847) 508-8048
3 in this area
366 Total Sales
Buyer's Agent in 2025
Paula McGrath
@ Properties
(847) 707-9208
7 in this area
27 Total Sales
Source: Midwest Real Estate Data (MRED)
MLS Number: 12470538
APN: 04-21-203-017-1069
Disclaimer: Certain information contained herein is derived from information provided by parties other than Homes.com. All information provided is deemed reliable, but is not guaranteed to be accurate and should be independently verified.
![]() Based on information submitted to the MLS GRID. All data is obtained from various sources and may not have been verified by broker or MLS GRID. Supplied Open House Information is subject to change without notice. All information should be independently reviewed and verified for accuracy. Properties may or may not be listed by the office/agent presenting the information. Some IDX listings have been excluded from this website.
Based on information submitted to the MLS GRID. All data is obtained from various sources and may not have been verified by broker or MLS GRID. Supplied Open House Information is subject to change without notice. All information should be independently reviewed and verified for accuracy. Properties may or may not be listed by the office/agent presenting the information. Some IDX listings have been excluded from this website.
The Digital Millennium Copyright Act of 1998, 17 U.S.C. § 512 (the “DMCA”) provides recourse for copyright owners who believe that material appearing on the Internet infringes their rights under U.S. copyright law. If you believe in good faith that any content or material made available in connection with our website or services infringes your copyright, you (or your agent) may send us a notice requesting that the content or material be removed, or access to it blocked.
Notices must be sent in writing by email to DMCAnotice@MLSGrid.com.
The DMCA requires that your notice of alleged copyright infringement include the following information:
(1) description of the copyrighted work that is the subject of claimed infringement;
(2) description of the alleged infringing content and information sufficient to permit us to locate the content;
(3) contact information for you, including your address, telephone number and email address;
(4) a statement by you that you have a good faith belief that the content in the manner complained of is not authorized by the copyright owner, or its agent, or by the operation of any law;
(5) a statement by you, signed under penalty of perjury, that the information in the notification is accurate and that you have the authority to enforce the copyrights that are claimed to be infringed; and
(6) a physical or electronic signature of the copyright owner or a person authorized to act on the copyright owner’s behalf. Failure to include all of the above information may result in the delay of the processing of your complaint.