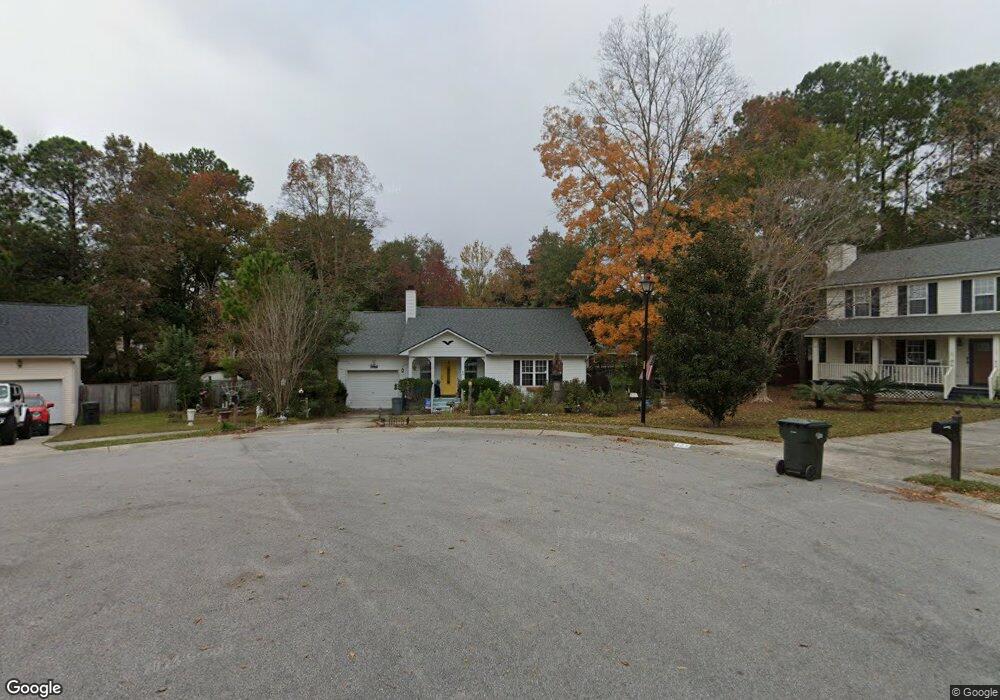
125 Round Table Ln Goose Creek, SC 29445
Estimated Value: $288,000 - $305,000
3
Beds
2
Baths
1,252
Sq Ft
$235/Sq Ft
Est. Value
About This Home
This home is located at 125 Round Table Ln, Goose Creek, SC 29445 and is currently estimated at $293,679, approximately $234 per square foot. 125 Round Table Ln is a home located in Berkeley County with nearby schools including Westview Primary School, Westview Elementary School, and Westview Middle School.
Ownership History
Date
Name
Owned For
Owner Type
Purchase Details
Closed on
Dec 28, 2011
Sold by
Rollins Penny R and Wilkinson Penny R
Bought by
Miorin Anton L and Miroin Kim A
Current Estimated Value
Home Financials for this Owner
Home Financials are based on the most recent Mortgage that was taken out on this home.
Original Mortgage
$96,002
Outstanding Balance
$67,430
Interest Rate
4.5%
Mortgage Type
FHA
Estimated Equity
$226,249
Purchase Details
Closed on
Oct 25, 2006
Sold by
Queen David M
Bought by
Wilkinson Penny R
Home Financials for this Owner
Home Financials are based on the most recent Mortgage that was taken out on this home.
Original Mortgage
$140,000
Interest Rate
6.39%
Mortgage Type
Future Advance Clause Open End Mortgage
Purchase Details
Closed on
Jun 20, 2002
Sold by
Bryan Cole J and Bryan Becki L
Bought by
Queen David M
Create a Home Valuation Report for This Property
The Home Valuation Report is an in-depth analysis detailing your home's value as well as a comparison with similar homes in the area
Home Values in the Area
Average Home Value in this Area
Purchase History
| Date | Buyer | Sale Price | Title Company |
|---|---|---|---|
| Miorin Anton L | $98,500 | -- | |
| Wilkinson Penny R | $140,000 | None Available | |
| Queen David M | $106,500 | -- |
Source: Public Records
Mortgage History
| Date | Status | Borrower | Loan Amount |
|---|---|---|---|
| Open | Miorin Anton L | $96,002 | |
| Previous Owner | Wilkinson Penny R | $140,000 |
Source: Public Records
Tax History Compared to Growth
Tax History
| Year | Tax Paid | Tax Assessment Tax Assessment Total Assessment is a certain percentage of the fair market value that is determined by local assessors to be the total taxable value of land and additions on the property. | Land | Improvement |
|---|---|---|---|---|
| 2025 | $603 | $123,918 | $31,474 | $92,444 |
| 2024 | $603 | $4,957 | $1,259 | $3,698 |
| 2023 | $603 | $4,957 | $1,259 | $3,698 |
| 2022 | $553 | $4,311 | $1,375 | $2,936 |
| 2021 | $581 | $4,310 | $1,375 | $2,936 |
| 2020 | $564 | $4,311 | $1,375 | $2,936 |
| 2019 | $527 | $4,311 | $1,375 | $2,936 |
| 2018 | $462 | $3,748 | $1,400 | $2,348 |
| 2017 | $460 | $3,748 | $1,400 | $2,348 |
| 2016 | $462 | $3,750 | $1,400 | $2,350 |
| 2015 | $445 | $3,750 | $1,400 | $2,350 |
| 2014 | $404 | $3,750 | $1,400 | $2,350 |
| 2013 | -- | $3,750 | $1,400 | $2,350 |
Source: Public Records
Map
Nearby Homes
- 121 Camelot Dr
- 0 Carolina Ave Unit 24013885
- 1001 Middleton Dr
- 2000 Middleton Dr
- 5000 Middleton Dr
- 4000 Middleton Dr
- 105 Magnolia Dr
- 112 Elaine St
- 109 Lyle Rd
- Aspen Plan at The Oaks
- Sago Plan at The Oaks
- Juniper II Plan at The Oaks
- Ivy Plan at The Oaks
- 222 Jennie St
- 208 Janice St
- 119 The Oaks Ave
- 100 Camellia Rd
- 301 Farm Rd
- 113 The Oaks Ave
- 112 Goose Creek Dr
- 123 Round Table Ln
- 107 Evatt Dr
- 127 Round Table Ln
- 109 Evatt Dr
- 126 Round Table Ln
- 115 Clay St
- 121 Round Table Ln
- 117 Clay St
- 122 Round Table Ln
- 124 Round Table Ln
- 119 Clay St
- 119 Round Table Ln
- 101 Camelot Dr
- 110 Evatt Dr
- 120 Round Table Ln
- 121 Clay St
- 100 Camelot Dr
- 117 Round Table Ln
- 114 Clay St
- 118 Round Table Ln