Estimated Value: $317,000 - $345,000
5
Beds
2
Baths
1,904
Sq Ft
$174/Sq Ft
Est. Value
About This Home
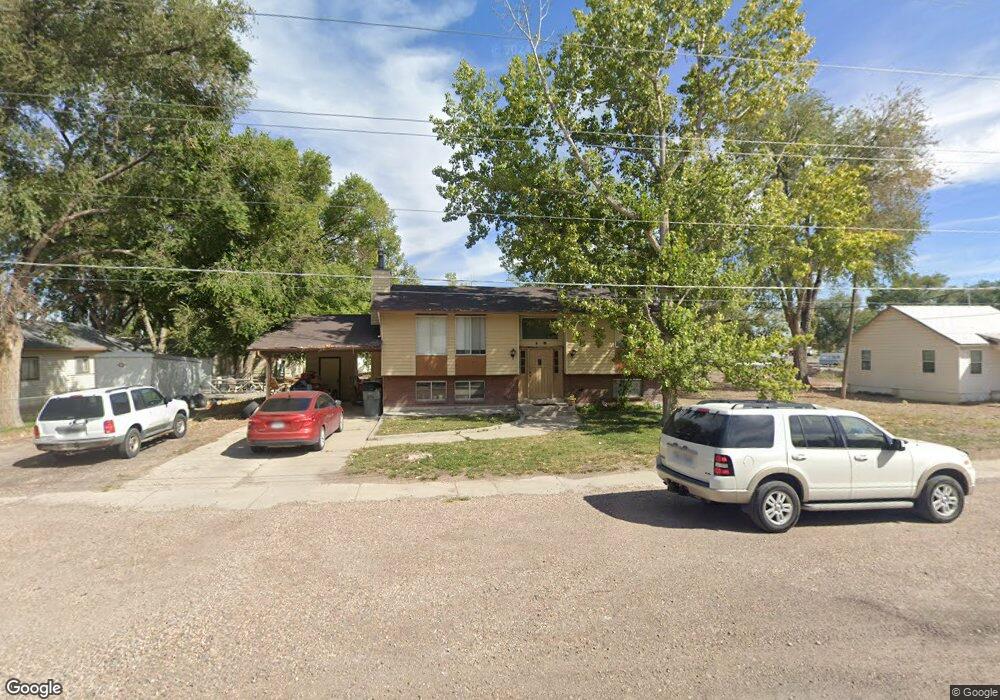
This home is located at 125 S 100 W, Delta, UT 84624 and is currently estimated at $330,470, approximately $173 per square foot. 125 S 100 W is a home located in Millard County with nearby schools including Cba Center and White River Academy.
Ownership History
Date
Name
Owned For
Owner Type
Purchase Details
Closed on
Mar 16, 2011
Sold by
Cahoon Alonzo and Cahoon Rebecca
Bought by
Coon Evan L and Coon Janice P
Current Estimated Value
Purchase Details
Closed on
Aug 17, 2009
Sold by
Fluckiger John Michael and Fluckiger Kristin
Bought by
Cahoon Alonzo and Cahoon Rebecca
Home Financials for this Owner
Home Financials are based on the most recent Mortgage that was taken out on this home.
Original Mortgage
$66,000
Interest Rate
5.09%
Purchase Details
Closed on
Dec 1, 2006
Sold by
Wells Fargo Bank
Bought by
Fluckiger John Michael and Fluckiger Kristin
Home Financials for this Owner
Home Financials are based on the most recent Mortgage that was taken out on this home.
Original Mortgage
$65,000
Interest Rate
6.1%
Mortgage Type
New Conventional
Purchase Details
Closed on
Apr 25, 2006
Sold by
Lundberg Scott and Steadman Troy
Bought by
Wells Fargo Bank Wells Fargo Bank N and Wells Fargo Bank A
Create a Home Valuation Report for This Property
The Home Valuation Report is an in-depth analysis detailing your home's value as well as a comparison with similar homes in the area
Home Values in the Area
Average Home Value in this Area
Purchase History
| Date | Buyer | Sale Price | Title Company |
|---|---|---|---|
| Coon Evan L | -- | -- | |
| Cahoon Alonzo | -- | -- | |
| Fluckiger John Michael | -- | -- | |
| Wells Fargo Bank Wells Fargo Bank N | $62,050 | -- |
Source: Public Records
Mortgage History
| Date | Status | Borrower | Loan Amount |
|---|---|---|---|
| Previous Owner | Cahoon Alonzo | $66,000 | |
| Previous Owner | Fluckiger John Michael | $65,000 |
Source: Public Records
Tax History Compared to Growth
Tax History
| Year | Tax Paid | Tax Assessment Tax Assessment Total Assessment is a certain percentage of the fair market value that is determined by local assessors to be the total taxable value of land and additions on the property. | Land | Improvement |
|---|---|---|---|---|
| 2025 | $1,377 | $147,153 | $16,379 | $130,774 |
| 2024 | $1,377 | $136,125 | $12,336 | $123,789 |
| 2023 | $1,697 | $136,125 | $12,336 | $123,789 |
| 2022 | $1,325 | $99,669 | $12,896 | $86,773 |
| 2021 | $1,123 | $80,587 | $9,752 | $70,835 |
| 2020 | $911 | $64,951 | $8,865 | $56,086 |
| 2019 | $916 | $65,418 | $8,209 | $57,209 |
| 2018 | $843 | $60,694 | $8,209 | $52,485 |
| 2017 | $872 | $60,455 | $7,970 | $52,485 |
| 2016 | $845 | $60,455 | $7,970 | $52,485 |
| 2015 | $844 | $60,455 | $7,970 | $52,485 |
| 2014 | -- | $53,050 | $7,970 | $45,080 |
| 2013 | -- | $53,050 | $7,970 | $45,080 |
Source: Public Records
Map
Nearby Homes
- 163 W 100 S
- 328 S Center St
- 32 E 300 S
- 38 E 300 S
- 294 S 300 W
- 242 S 400 W
- 435 W 100 S
- 185 N 200 W
- 0 E Highway 6 Unit LotWP001 16586023
- 331 W 200 N
- 44 E 300 S
- 321 E 200 S
- 325 N 100 W
- 451 W 300 N
- 445 Topaz Blvd Unit 10
- 461 Topaz Blvd Unit 6
- 7900 E 250 Rd N
- 625 E Birch Dr
- 665 Bristlecone Ln
- 263 Silver Maple Dr