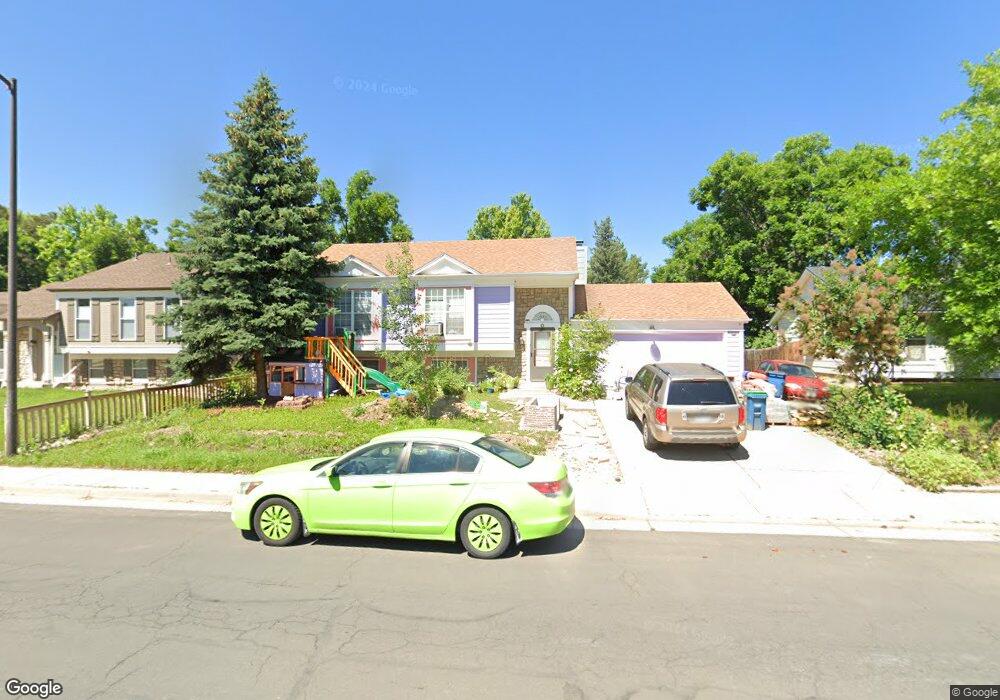
125 S Polk Ave Louisville, CO 80027
Estimated Value: $682,123 - $759,000
4
Beds
2
Baths
1,872
Sq Ft
$391/Sq Ft
Est. Value
About This Home
This home is located at 125 S Polk Ave, Louisville, CO 80027 and is currently estimated at $731,031, approximately $390 per square foot. 125 S Polk Ave is a home located in Boulder County with nearby schools including Fireside Elementary School, Monarch K-8 School, and Monarch High School.
Ownership History
Date
Name
Owned For
Owner Type
Purchase Details
Closed on
May 16, 2005
Sold by
Mcgee Michael S
Bought by
Young Jackies Kienlai
Current Estimated Value
Home Financials for this Owner
Home Financials are based on the most recent Mortgage that was taken out on this home.
Original Mortgage
$191,100
Outstanding Balance
$100,152
Interest Rate
5.92%
Mortgage Type
New Conventional
Estimated Equity
$630,879
Purchase Details
Closed on
Jun 7, 1997
Sold by
Carl T Cowley
Bought by
Mcgee Michael S
Purchase Details
Closed on
Jan 30, 1995
Sold by
Gose Frank J and Gose Sandra K
Bought by
Mcgee Michael S
Home Financials for this Owner
Home Financials are based on the most recent Mortgage that was taken out on this home.
Original Mortgage
$134,910
Interest Rate
9.2%
Purchase Details
Closed on
Jan 11, 1989
Bought by
Young Jackies Kienlai
Purchase Details
Closed on
Feb 18, 1983
Bought by
Young Jackies Kienlai
Create a Home Valuation Report for This Property
The Home Valuation Report is an in-depth analysis detailing your home's value as well as a comparison with similar homes in the area
Home Values in the Area
Average Home Value in this Area
Purchase History
| Date | Buyer | Sale Price | Title Company |
|---|---|---|---|
| Young Jackies Kienlai | $254,900 | Chicago Title Co | |
| Mcgee Michael S | -- | -- | |
| Mcgee Michael S | $149,900 | Commonwealth Land Title Ins | |
| Young Jackies Kienlai | $101,500 | -- | |
| Young Jackies Kienlai | $86,000 | -- |
Source: Public Records
Mortgage History
| Date | Status | Borrower | Loan Amount |
|---|---|---|---|
| Open | Young Jackies Kienlai | $191,100 | |
| Previous Owner | Mcgee Michael S | $134,910 |
Source: Public Records
Tax History Compared to Growth
Tax History
| Year | Tax Paid | Tax Assessment Tax Assessment Total Assessment is a certain percentage of the fair market value that is determined by local assessors to be the total taxable value of land and additions on the property. | Land | Improvement |
|---|---|---|---|---|
| 2025 | $4,074 | $46,300 | $20,194 | $26,106 |
| 2024 | $4,074 | $46,300 | $20,194 | $26,106 |
| 2023 | $4,005 | $45,332 | $21,386 | $27,631 |
| 2022 | $3,479 | $36,154 | $16,048 | $20,106 |
| 2021 | $3,626 | $39,154 | $17,382 | $21,772 |
| 2020 | $3,346 | $35,750 | $14,014 | $21,736 |
| 2019 | $3,298 | $35,750 | $14,014 | $21,736 |
| 2018 | $2,628 | $29,412 | $9,432 | $19,980 |
| 2017 | $2,575 | $32,517 | $10,428 | $22,089 |
| 2016 | $2,596 | $29,508 | $11,303 | $18,205 |
| 2015 | $2,461 | $25,933 | $14,248 | $11,685 |
| 2014 | $2,217 | $25,933 | $14,248 | $11,685 |
Source: Public Records
Map
Nearby Homes
- 159 S Polk Ave
- 408 Fillmore Ct
- 641 W Dahlia St
- 118 S Tanager Ct
- 494 Owl Dr Unit 4
- 592 Spruce Cir
- 279 S Taft Ct Unit 53
- 284 S Taft Ct Unit 76
- 812 W Mulberry St
- 323 S Taft Ct Unit 26
- 362 S Taft Ct Unit 108
- 291 W Sycamore Ln
- 426 W Spruce Ln
- 539 Coal Creek Ln
- 810 Trail Ridge Dr
- 749 Apple Ct
- 593 Wildrose Way
- 567 Manorwood Ln
- 203 Springs Dr
- 823 Trail Ridge Dr
- 113 S Polk Ave
- 126 S Fillmore Ave
- 134 S Fillmore Ave
- 114 S Fillmore Ave
- 143 S Polk Ave
- 109 S Polk Ave
- 128 S Polk Ave
- 110 S Polk Ave
- 102 S Fillmore Ave
- 146 S Polk Ave
- 104 S Polk Ave
- 156 S Fillmore Ave
- 129 S Fillmore Ave
- 119 S Buchanan Ct
- 133 S Fillmore Ave
- 115 S Fillmore Ave
- 152 S Polk Ave
- 117 S Buchanan Ct
- 102 S Polk Ave
- 165 S Polk Ave