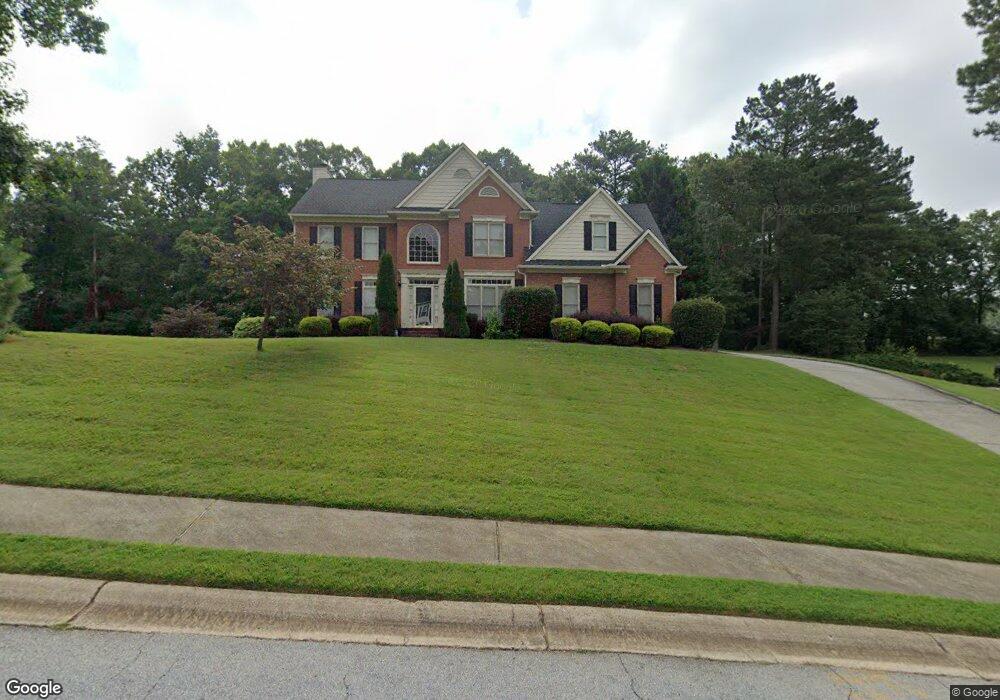
125 Scenic Pass Fayetteville, GA 30215
Estimated Value: $551,000 - $559,000
6
Beds
5
Baths
3,911
Sq Ft
$142/Sq Ft
Est. Value
About This Home
This home is located at 125 Scenic Pass, Fayetteville, GA 30215 and is currently estimated at $554,618, approximately $141 per square foot. 125 Scenic Pass is a home located in Fayette County with nearby schools including Sara Harp Minter Elementary School, Whitewater Middle School, and Whitewater High School.
Ownership History
Date
Name
Owned For
Owner Type
Purchase Details
Closed on
Jun 21, 2021
Sold by
Wheeler Tameika D
Bought by
Adeniyi Bukola and Adeniyi Oluwafemi S
Current Estimated Value
Home Financials for this Owner
Home Financials are based on the most recent Mortgage that was taken out on this home.
Original Mortgage
$389,500
Outstanding Balance
$352,644
Interest Rate
2.9%
Mortgage Type
New Conventional
Estimated Equity
$201,974
Purchase Details
Closed on
May 5, 2017
Sold by
Wheeler Tameika D
Bought by
Wheeler Tameike D and Hall Ricky Maurice
Purchase Details
Closed on
Sep 25, 2015
Sold by
Ross Terence A
Bought by
Wheeler Tamelka D
Home Financials for this Owner
Home Financials are based on the most recent Mortgage that was taken out on this home.
Original Mortgage
$311,748
Interest Rate
3.75%
Mortgage Type
FHA
Purchase Details
Closed on
Nov 1, 1995
Sold by
Wieland Homes
Bought by
Ross Terence A Andrea D
Create a Home Valuation Report for This Property
The Home Valuation Report is an in-depth analysis detailing your home's value as well as a comparison with similar homes in the area
Home Values in the Area
Average Home Value in this Area
Purchase History
| Date | Buyer | Sale Price | Title Company |
|---|---|---|---|
| Adeniyi Bukola | $425,000 | -- | |
| Wheeler Tameike D | -- | -- | |
| Wheeler Tamelka D | $317,500 | -- | |
| Ross Terence A Andrea D | $205,100 | -- |
Source: Public Records
Mortgage History
| Date | Status | Borrower | Loan Amount |
|---|---|---|---|
| Open | Adeniyi Bukola | $389,500 | |
| Previous Owner | Wheeler Tamelka D | $311,748 | |
| Closed | Ross Terence A Andrea D | $0 |
Source: Public Records
Tax History Compared to Growth
Tax History
| Year | Tax Paid | Tax Assessment Tax Assessment Total Assessment is a certain percentage of the fair market value that is determined by local assessors to be the total taxable value of land and additions on the property. | Land | Improvement |
|---|---|---|---|---|
| 2024 | $6,146 | $206,792 | $36,000 | $170,792 |
| 2023 | $6,042 | $198,480 | $35,960 | $162,520 |
| 2022 | $5,166 | $170,000 | $23,960 | $146,040 |
| 2021 | $3,912 | $141,640 | $20,000 | $121,640 |
| 2020 | $4,102 | $134,720 | $20,000 | $114,720 |
| 2019 | $3,964 | $129,000 | $20,000 | $109,000 |
| 2018 | $3,586 | $115,680 | $19,200 | $96,480 |
| 2017 | $3,385 | $115,400 | $19,200 | $96,200 |
| 2016 | $3,192 | $106,680 | $19,200 | $87,480 |
| 2015 | $3,058 | $100,520 | $19,200 | $81,320 |
| 2014 | $2,852 | $92,240 | $19,200 | $73,040 |
| 2013 | -- | $80,320 | $0 | $0 |
Source: Public Records
Map
Nearby Homes
- 115 Monte Ridge Way
- 110 Mourning Dove Dr S
- 105 Windridge Dr
- 315 Walker Ave
- 105 Hollis St
- 105 Roxbrough Ln Unit 7A
- LOT 2 SOUTH OF Redwine Rd Unit LOT 2 SOUTH OF 1585
- 430 Plainfield St
- 180 Plainfield St
- 665 Beauregard Blvd
- 220 Saddle Ridge Way Unit 1
- 145 Saddle Ridge Way
- 110 Sparrows Cove
- 994 Highway 85 S
- 120 Deep Forest Ln Unit 1
- 295 Cobalt Dr
- 315 Cobalt Dr
- 1305 & 1307 Highway 54
- 110 Lindsey Terrace
- 335 Burch Rd
- 125 Scenic Pass Unit 11A
- 115 Scenic Pass
- 135 Scenic Pass
- 100 Scenic Ct
- 165 Partridge Point
- 205 Highview Trace
- 145 Scenic Pass
- 175 Partridge Point
- 215 Highview Trace
- 155 Partridge Point
- 335 Oakleigh Manor Dr
- 120 Scenic Pass
- 195 Highview Trace
- 145 Partridge Point Unit 145
- 0 Partridge Point Unit 7330368
- 0 Partridge Point Unit 7153284
- 0 Partridge Point Unit 7204565
- 0 Partridge Point Unit 7200400
- 0 Partridge Point Unit 3253780
- 0 Partridge Point Unit 7427171