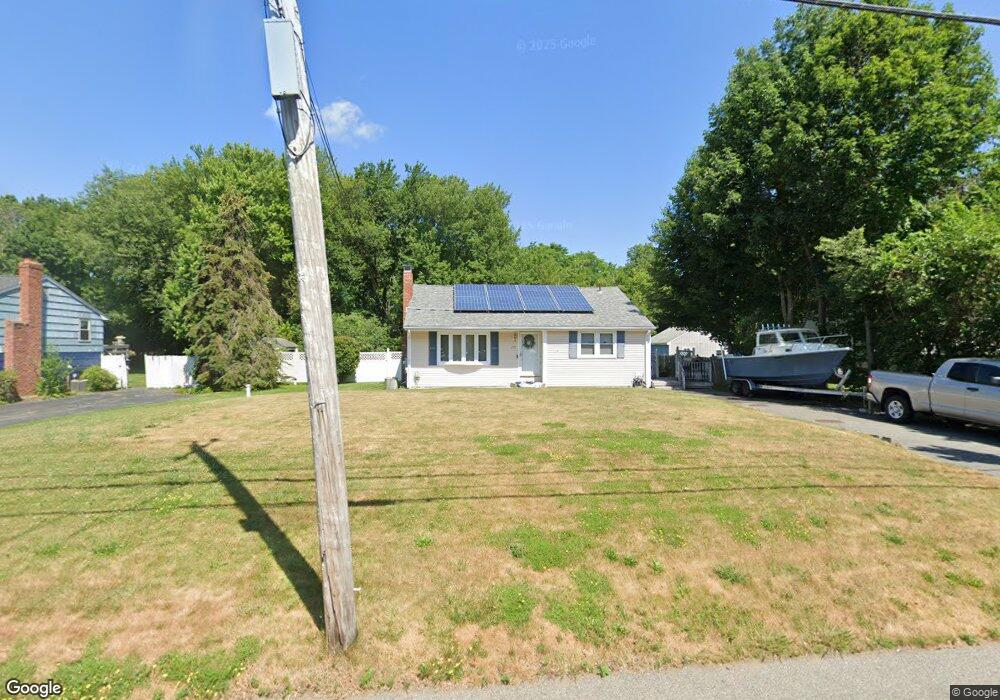
125 Spring St East Bridgewater, MA 02333
Estimated Value: $444,000 - $539,000
3
Beds
2
Baths
1,040
Sq Ft
$478/Sq Ft
Est. Value
About This Home
This home is located at 125 Spring St, East Bridgewater, MA 02333 and is currently estimated at $497,443, approximately $478 per square foot. 125 Spring St is a home located in Plymouth County with nearby schools including Central Elementary School, Gordon W Mitchell Middle School, and East Bridgewater Jr./Sr. High School.
Ownership History
Date
Name
Owned For
Owner Type
Purchase Details
Closed on
Nov 2, 2009
Sold by
Fontaine Kenneth E
Bought by
Sesin Stephen M and Eldredge Carol J
Current Estimated Value
Home Financials for this Owner
Home Financials are based on the most recent Mortgage that was taken out on this home.
Original Mortgage
$180,000
Outstanding Balance
$117,893
Interest Rate
5.06%
Mortgage Type
Purchase Money Mortgage
Estimated Equity
$379,550
Create a Home Valuation Report for This Property
The Home Valuation Report is an in-depth analysis detailing your home's value as well as a comparison with similar homes in the area
Home Values in the Area
Average Home Value in this Area
Purchase History
| Date | Buyer | Sale Price | Title Company |
|---|---|---|---|
| Sesin Stephen M | $255,000 | -- |
Source: Public Records
Mortgage History
| Date | Status | Borrower | Loan Amount |
|---|---|---|---|
| Open | Sesin Stephen M | $180,000 |
Source: Public Records
Tax History Compared to Growth
Tax History
| Year | Tax Paid | Tax Assessment Tax Assessment Total Assessment is a certain percentage of the fair market value that is determined by local assessors to be the total taxable value of land and additions on the property. | Land | Improvement |
|---|---|---|---|---|
| 2025 | $5,741 | $420,000 | $167,700 | $252,300 |
| 2024 | $5,591 | $404,000 | $161,300 | $242,700 |
| 2023 | $5,533 | $382,900 | $161,300 | $221,600 |
| 2022 | $5,448 | $349,200 | $146,700 | $202,500 |
| 2021 | $5,154 | $302,300 | $133,500 | $168,800 |
| 2020 | $4,815 | $278,500 | $121,300 | $157,200 |
| 2019 | $4,703 | $267,800 | $115,900 | $151,900 |
| 2018 | $4,280 | $238,300 | $109,100 | $129,200 |
| 2017 | $4,158 | $227,200 | $104,000 | $123,200 |
| 2016 | $4,157 | $228,900 | $110,500 | $118,400 |
| 2015 | $4,357 | $245,300 | $129,100 | $116,200 |
| 2014 | $4,181 | $240,700 | $126,400 | $114,300 |
Source: Public Records
Map
Nearby Homes