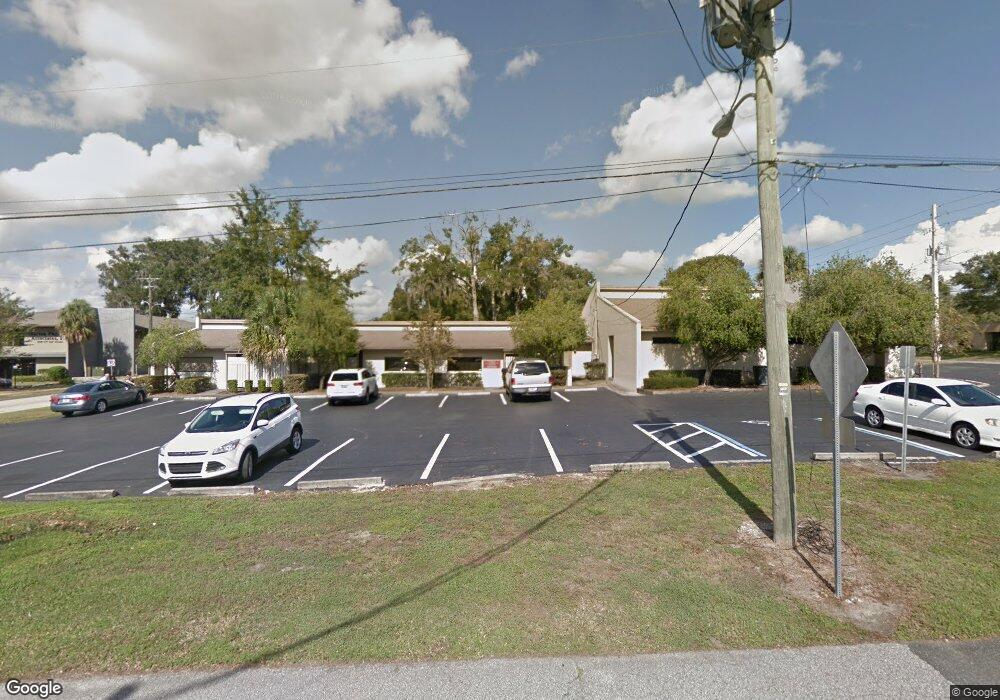
125 SW 11th St Unit 127 Ocala, FL 34471
Downtown Ocala NeighborhoodEstimated Value: $1,501,421
2
Beds
10
Baths
1,021
Sq Ft
$1,471/Sq Ft
Est. Value
About This Home
This home is located at 125 SW 11th St Unit 127, Ocala, FL 34471 and is currently estimated at $1,501,421, approximately $1,470 per square foot. 125 SW 11th St Unit 127 is a home located in Marion County with nearby schools including Eighth Street Elementary School, Osceola Middle School, and Forest High School.
Ownership History
Date
Name
Owned For
Owner Type
Purchase Details
Closed on
Dec 20, 2013
Sold by
Dulworth & Rives Inc
Bought by
Rkj Of Ocala Llc
Current Estimated Value
Home Financials for this Owner
Home Financials are based on the most recent Mortgage that was taken out on this home.
Original Mortgage
$480,000
Interest Rate
4.19%
Mortgage Type
Future Advance Clause Open End Mortgage
Purchase Details
Closed on
Jul 23, 2008
Sold by
Barhoush A J and Barhoush Ahmed
Bought by
Dulworth & Rives Inc
Purchase Details
Closed on
Aug 1, 2005
Sold by
A J Barhoush Md Pa Profit Sharing Plan & and Barhoush Aj
Bought by
Rj Partnership Llp
Purchase Details
Closed on
Oct 31, 2002
Sold by
Aramco Investment & Trade Inc
Bought by
A J Barhoush Md Pa Profit Sharing Plan & and Barhoush A J
Create a Home Valuation Report for This Property
The Home Valuation Report is an in-depth analysis detailing your home's value as well as a comparison with similar homes in the area
Home Values in the Area
Average Home Value in this Area
Purchase History
| Date | Buyer | Sale Price | Title Company |
|---|---|---|---|
| Rkj Of Ocala Llc | $602,400 | Attorney | |
| Dulworth & Rives Inc | $1,600,000 | Ocala Land Title Insurance A | |
| Rj Partnership Llp | $146,428 | -- | |
| A J Barhoush Md Pa Profit Sharing Plan & | $412,000 | -- |
Source: Public Records
Mortgage History
| Date | Status | Borrower | Loan Amount |
|---|---|---|---|
| Closed | Rkj Of Ocala Llc | $480,000 |
Source: Public Records
Tax History Compared to Growth
Tax History
| Year | Tax Paid | Tax Assessment Tax Assessment Total Assessment is a certain percentage of the fair market value that is determined by local assessors to be the total taxable value of land and additions on the property. | Land | Improvement |
|---|---|---|---|---|
| 2024 | $18,616 | $972,228 | $275,275 | $696,953 |
| 2023 | $18,716 | $971,475 | $235,950 | $735,525 |
| 2022 | $17,261 | $927,041 | $196,625 | $730,416 |
| 2021 | $17,970 | $899,489 | $157,300 | $742,189 |
| 2020 | $16,419 | $897,985 | $157,300 | $740,685 |
| 2019 | $15,938 | $863,211 | $143,000 | $720,211 |
| 2018 | $15,645 | $860,908 | $143,000 | $717,908 |
| 2017 | $15,924 | $862,132 | $143,000 | $719,132 |
| 2016 | $16,078 | $859,869 | $0 | $0 |
| 2015 | $15,078 | $793,927 | $0 | $0 |
| 2014 | $13,789 | $779,997 | $0 | $0 |
Source: Public Records
Map
Nearby Homes
- 0 0 Unit A11892293
- 0 0 Unit F10525843
- 0 0 Unit A11629295
- TBD SW 57th Place
- 504 SE 11th St
- 419 SE 1st Ave Unit 101
- 419 SE 1st Ave Unit 103
- 419 SE 1st Ave Unit 204
- 419 SE 1st Ave Unit 203
- 419 SE 1st Ave Unit 304
- 419 SE 1st Ave Unit 302
- 419 SE 1st Ave Unit 201
- 419 SE 1st Ave Unit 301
- 0 SW 14 St Rd Unit MFROM663132
- 00 SW 15th Place
- 415 SE 1st Ave Unit 103
- 415 SE 1st Ave Unit 101
- 0 SW 16th Place
- 707 SE 10th Place
- 0 SE 17th St
- 129 SW 11th St
- SW 11th St
- 206 SW 10th St
- 218 SW 10th St
- 232 SW 10th St
- 910 SW 1st Ave Unit 202
- 910 SW 1st Ave Unit 201
- 910 SW 1st Ave
- 221 SW 10th St
- 40 SW 12th St Unit 201B
- 40 SW 12th St Unit A101 & A102
- 40 SW 12th St Unit A201
- 40 SW 12th St
- 200 SW 8th St
- 14 SW 12th St
- 12 SW 12th St
- 1022 S Pine Ave
- 13 SW 12th St
- 801 SW 1 Ave
- 904 SE 1st Terrace