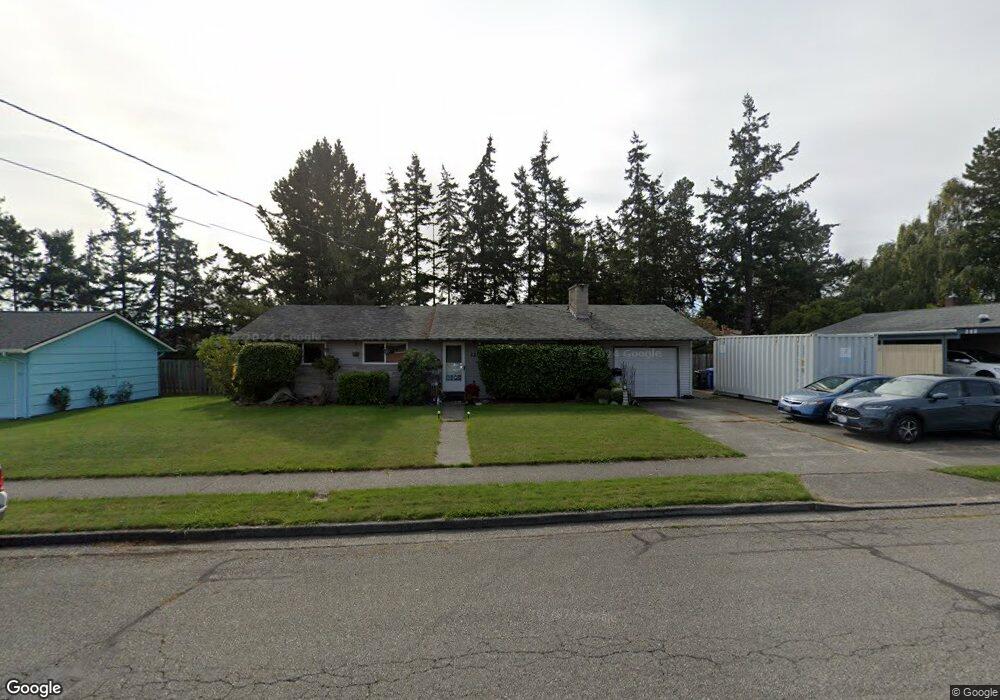
125 SW 8th Ave Oak Harbor, WA 98277
Estimated Value: $408,000 - $475,000
3
Beds
2
Baths
1,268
Sq Ft
$342/Sq Ft
Est. Value
About This Home
This home is located at 125 SW 8th Ave, Oak Harbor, WA 98277 and is currently estimated at $433,702, approximately $342 per square foot. 125 SW 8th Ave is a home located in Island County with nearby schools including Broadview Elementary School, Oak Harbor Middle School, and Oak Harbor High School.
Ownership History
Date
Name
Owned For
Owner Type
Purchase Details
Closed on
Mar 9, 2013
Sold by
Curtis Michael Keith
Bought by
Curtis Shelley A
Current Estimated Value
Home Financials for this Owner
Home Financials are based on the most recent Mortgage that was taken out on this home.
Original Mortgage
$172,700
Outstanding Balance
$121,061
Interest Rate
3.47%
Mortgage Type
New Conventional
Estimated Equity
$312,641
Purchase Details
Closed on
Apr 20, 2004
Sold by
Gunsauls Elma M
Bought by
Curtis Shelley A
Home Financials for this Owner
Home Financials are based on the most recent Mortgage that was taken out on this home.
Original Mortgage
$143,867
Interest Rate
5.39%
Mortgage Type
FHA
Purchase Details
Closed on
Mar 11, 2004
Sold by
Curtis Michael
Bought by
Curtis Shelley A
Home Financials for this Owner
Home Financials are based on the most recent Mortgage that was taken out on this home.
Original Mortgage
$143,867
Interest Rate
5.39%
Mortgage Type
FHA
Create a Home Valuation Report for This Property
The Home Valuation Report is an in-depth analysis detailing your home's value as well as a comparison with similar homes in the area
Home Values in the Area
Average Home Value in this Area
Purchase History
| Date | Buyer | Sale Price | Title Company |
|---|---|---|---|
| Curtis Shelley A | -- | Lsi North Recording Division | |
| Curtis Shelley A | $145,900 | Land Title Company Island Co | |
| Curtis Shelley A | -- | Land Title Company Island Co |
Source: Public Records
Mortgage History
| Date | Status | Borrower | Loan Amount |
|---|---|---|---|
| Open | Curtis Shelley A | $172,700 | |
| Closed | Curtis Shelley A | $143,867 |
Source: Public Records
Tax History Compared to Growth
Tax History
| Year | Tax Paid | Tax Assessment Tax Assessment Total Assessment is a certain percentage of the fair market value that is determined by local assessors to be the total taxable value of land and additions on the property. | Land | Improvement |
|---|---|---|---|---|
| 2025 | $3,171 | $390,980 | $200,000 | $190,980 |
| 2024 | $3,215 | $373,699 | $180,000 | $193,699 |
| 2023 | $3,215 | $380,980 | $190,000 | $190,980 |
| 2022 | $2,946 | $355,396 | $180,000 | $175,396 |
| 2021 | $2,699 | $274,667 | $120,000 | $154,667 |
| 2020 | $2,791 | $250,770 | $100,000 | $150,770 |
| 2019 | $2,374 | $256,737 | $150,000 | $106,737 |
| 2018 | $2,394 | $237,095 | $130,000 | $107,095 |
| 2017 | $2,052 | $210,700 | $110,000 | $100,700 |
| 2016 | $1,927 | $192,138 | $90,000 | $102,138 |
| 2015 | -- | $173,578 | $70,000 | $103,578 |
| 2013 | -- | $161,455 | $55,000 | $106,455 |
Source: Public Records
Map
Nearby Homes
- 270 SE Barrington Dr Unit A-304
- 185 SW 3rd Ave
- 280 SW Ballast Way
- 1101 SW Harrier Cir Unit 106
- 476 SE Barrington Dr Unit E
- 427 SE Ely St
- 660 SW Harrier Cir Unit 1
- 161 W Whidbey Ave Unit 4
- 161 W Whidbey Ave Unit 26
- 583 SE 6th Ave
- 984 SW 6th Ave
- 478 SW Judson Dr
- 44 SW Festival St
- 485 SW Bayshore Dr Unit C201
- 0 SE Bayshore Dr Unit NWM2377102
- 942 SW Barrington Dr
- 356 SW Judson Dr
- 30901 State Route 20 Unit D2
- 110 N Oak Harbor St
- 651 SE Bayshore Dr Unit B304
- 145 SW 8th Ave
- 89 SW 8th Ave
- 167 SW 8th Ave
- 65 SW 8th Ave
- 920 SW Bowmer St
- 124 SW 8th Ave
- 144 SW 8th Ave
- 164 SW 8th Ave
- 980 SW Bowmer St
- 49 SW 8th Ave
- 188 SW 8th Ave
- 50 SW 8th Ave
- 1020 SW Bowmer St
- 231 SW 8th Ave
- 230 SW 10th Ave
- 21 SW 8th Ave
- 226 SW 8th Ave
- 1040 SW Bowmer St
- 165 SW 6th Ave
- 255 SW 8th Ave