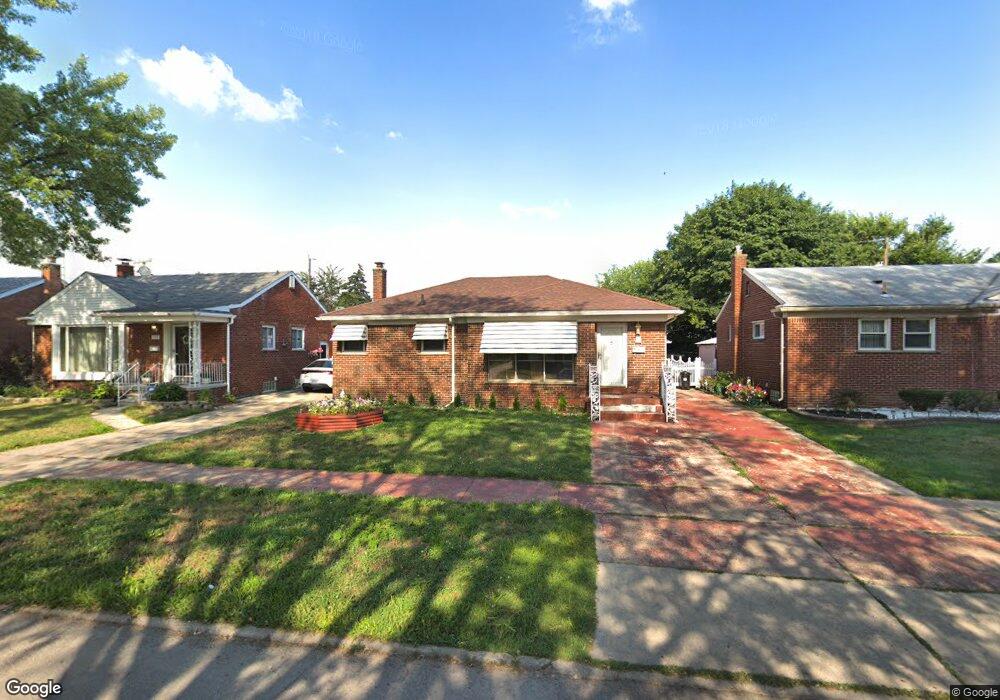
125 Vincent St Inkster, MI 48141
Estimated Value: $113,715 - $165,000
Studio
1
Bath
1,002
Sq Ft
$139/Sq Ft
Est. Value
About This Home
This home is located at 125 Vincent St, Inkster, MI 48141 and is currently estimated at $139,179, approximately $138 per square foot. 125 Vincent St is a home located in Wayne County with nearby schools including David Hicks School, Benjamin Franklin Middle School, and John Glenn High School.
Ownership History
Date
Name
Owned For
Owner Type
Purchase Details
Closed on
Nov 21, 2024
Sold by
Faour Zeinab Hussein
Bought by
Kassem Hussein Mohamad
Current Estimated Value
Purchase Details
Closed on
Jul 7, 2015
Sold by
Deaify Ahmad M and Deaify Tracy G
Bought by
Kassem Hussein
Home Financials for this Owner
Home Financials are based on the most recent Mortgage that was taken out on this home.
Original Mortgage
$35,000
Interest Rate
5%
Mortgage Type
Seller Take Back
Purchase Details
Closed on
Nov 7, 2003
Sold by
Deaify Ahmad M
Bought by
Deaify Ahmad M
Home Financials for this Owner
Home Financials are based on the most recent Mortgage that was taken out on this home.
Original Mortgage
$72,100
Interest Rate
6.01%
Mortgage Type
New Conventional
Purchase Details
Closed on
Apr 12, 1995
Sold by
Henry Wayne A
Bought by
Ahmad M Deaify
Create a Home Valuation Report for This Property
The Home Valuation Report is an in-depth analysis detailing your home's value as well as a comparison with similar homes in the area
Home Values in the Area
Average Home Value in this Area
Purchase History
| Date | Buyer | Sale Price | Title Company |
|---|---|---|---|
| Kassem Hussein Mohamad | -- | None Listed On Document | |
| Kassem Hussein | $35,000 | None Available | |
| Kassem Hussein | $35,000 | Title One Inc | |
| Deaify Ahmad M | -- | H & H Title Inc | |
| Ahmad M Deaify | $55,000 | -- |
Source: Public Records
Mortgage History
| Date | Status | Borrower | Loan Amount |
|---|---|---|---|
| Previous Owner | Kassem Hussein | $35,000 | |
| Previous Owner | Deaify Ahmad M | $72,100 |
Source: Public Records
Tax History
| Year | Tax Paid | Tax Assessment Tax Assessment Total Assessment is a certain percentage of the fair market value that is determined by local assessors to be the total taxable value of land and additions on the property. | Land | Improvement |
|---|---|---|---|---|
| 2025 | $1,231 | $58,800 | $0 | $0 |
| 2024 | $1,199 | $49,200 | $0 | $0 |
| 2023 | $1,198 | $39,000 | $0 | $0 |
| 2022 | $1,478 | $31,500 | $0 | $0 |
| 2021 | $1,563 | $28,400 | $0 | $0 |
| 2020 | $1,525 | $24,000 | $0 | $0 |
| 2019 | $1,521 | $20,000 | $0 | $0 |
| 2018 | $1,086 | $18,900 | $0 | $0 |
| 2017 | $610 | $18,700 | $0 | $0 |
| 2016 | $1,505 | $18,800 | $0 | $0 |
| 2015 | $2,590 | $25,900 | $0 | $0 |
| 2013 | $3,500 | $35,000 | $0 | $0 |
| 2012 | $1,766 | $37,200 | $4,100 | $33,100 |
Source: Public Records
Map
Nearby Homes
- 0 John Daly Unit 20261009623
- 6 Canfield Cir
- 26573 Somerset Dr
- 26235 Stollman Dr
- 112 Brentwood St
- 26044 Cherry Hill Rd
- 26251 Somerset Dr
- 420 Fairwood St
- 535 Sherbourne St
- 1121 Meadowbrook St
- 26429 Wilson Dr
- 27051 Avondale St
- 391 Arcola St
- 375 Arcola St
- 25703 Loch Lomond Dr
- 824 N Beech Daly Rd Unit 13
- 139 Belton St
- 1310 Plainfield St
- VACANT LOT Tromley St
- 201 Cardwell St
Your Personal Tour Guide
Ask me questions while you tour the home.