
125 W 300 S Ephraim, UT 84627
Estimated payment $2,283/month
Highlights
- Barn
- RV or Boat Parking
- Fruit Trees
- Spa
- 1.5 Acre Lot
- Mountain View
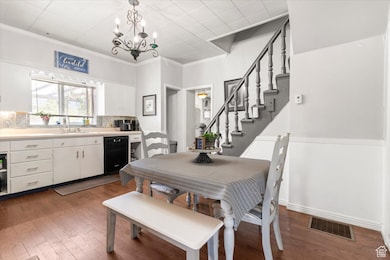
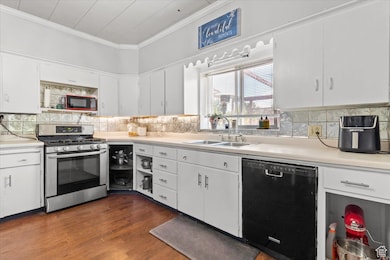
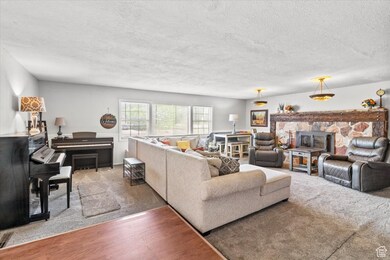
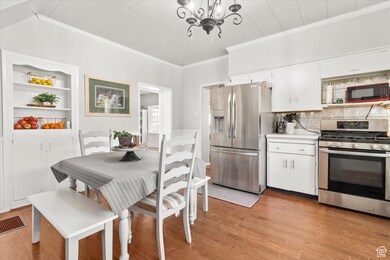
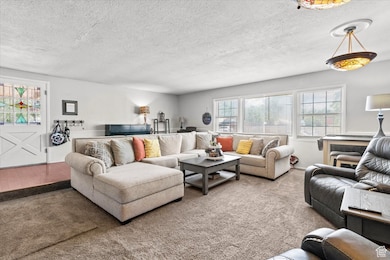
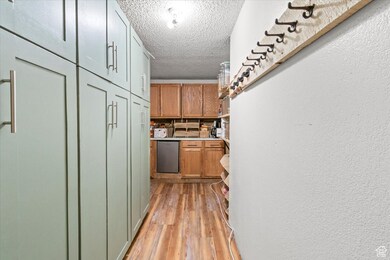
About This Home
Rare find within Ephraim City limits! This charming two-story home sits on 1.5 fully fenced acres and offers a unique blend of comfort, space, and rural charm. With 4 bedrooms and an optional 5th, along with 2 completely remodeled bathrooms, the home features recent updates including a new furnace and two cozy wood-burning fireplaces. You'll love the character throughout, especially the bright sunroom located at the back of the house. The property boasts an incredible outdoor setup with a spacious fenced yard, mature shade trees, fruit trees, and a designated garden area. Enjoy relaxing evenings in the hot tub or entertaining in the open outdoor space. Additional features include a separate gravel driveway, multiple outbuildings, animal pens, fenced pasture, an automatic sprinkler system, and a detached one-car garage. Properties like this don't come around often-schedule your showing today before it's gone!
Listing Agent
Century 21 Essentials Realty License #4811248 Listed on: 06/06/2025
Home Details
Home Type
- Single Family
Est. Annual Taxes
- $2,366
Year Built
- Built in 1908
Lot Details
- 1.5 Acre Lot
- Lot Dimensions are 198.0x330.0x198.0
- Landscaped
- Secluded Lot
- Mountainous Lot
- Fruit Trees
- Mature Trees
- Property is zoned Single-Family, R2
Parking
- 1 Car Attached Garage
- 4 Open Parking Spaces
- RV or Boat Parking
Home Design
- Brick Exterior Construction
Interior Spaces
- 3,067 Sq Ft Home
- 2-Story Property
- 1 Fireplace
- Double Pane Windows
- Blinds
- Mountain Views
- Gas Dryer Hookup
Kitchen
- Gas Range
- Disposal
Flooring
- Wood
- Carpet
- Linoleum
- Tile
Bedrooms and Bathrooms
- 5 Bedrooms | 2 Main Level Bedrooms
- Primary Bedroom on Main
- 2 Full Bathrooms
Outdoor Features
- Spa
- Open Patio
- Outbuilding
- Porch
Schools
- Ephraim Elementary And Middle School
- Manti High School
Farming
- Barn
Utilities
- Window Unit Cooling System
- Central Heating
- Heating System Uses Wood
- Natural Gas Connected
Community Details
- No Home Owners Association
Listing and Financial Details
- Assessor Parcel Number 00000784X1
Map
Home Values in the Area
Average Home Value in this Area
Tax History
| Year | Tax Paid | Tax Assessment Tax Assessment Total Assessment is a certain percentage of the fair market value that is determined by local assessors to be the total taxable value of land and additions on the property. | Land | Improvement |
|---|---|---|---|---|
| 2024 | $2,131 | $196,173 | $0 | $0 |
| 2023 | $2,102 | $184,199 | $0 | $0 |
| 2022 | $2,119 | $169,228 | $0 | $0 |
| 2021 | $2,087 | $143,997 | $0 | $0 |
| 2020 | $1,955 | $127,000 | $0 | $0 |
| 2019 | $1,855 | $118,570 | $0 | $0 |
| 2018 | $1,674 | $180,171 | $54,549 | $125,622 |
| 2017 | $1,492 | $96,186 | $0 | $0 |
| 2016 | $1,398 | $90,135 | $0 | $0 |
| 2015 | $1,404 | $90,135 | $0 | $0 |
| 2014 | $1,382 | $90,135 | $0 | $0 |
| 2013 | $1,375 | $90,135 | $0 | $0 |
Property History
| Date | Event | Price | Change | Sq Ft Price |
|---|---|---|---|---|
| 08/29/2025 08/29/25 | Pending | -- | -- | -- |
| 08/08/2025 08/08/25 | Price Changed | $395,000 | -6.0% | $129 / Sq Ft |
| 07/23/2025 07/23/25 | Price Changed | $420,000 | -2.3% | $137 / Sq Ft |
| 06/06/2025 06/06/25 | For Sale | $430,000 | -- | $140 / Sq Ft |
Purchase History
| Date | Type | Sale Price | Title Company |
|---|---|---|---|
| Grant Deed | $316,657 | First American-Ephraim | |
| Warranty Deed | -- | -- | |
| Warranty Deed | -- | -- |
Mortgage History
| Date | Status | Loan Amount | Loan Type |
|---|---|---|---|
| Open | $253,326 | Construction |
Source: UtahRealEstate.com
MLS Number: 2090267
APN: 00000784X1
Disclaimer: Certain information contained herein is derived from information provided by parties other than Homes.com. All information provided is deemed reliable, but is not guaranteed to be accurate and should be independently verified.
![]() IDX information is provided exclusively for consumers’ personal, non-commercial use, that it may not be used for any purpose other than to identify prospective properties consumers may be interested in purchasing, and that the data is deemed reliable but is not guaranteed accurate by the MLS. Licensor is only providing the MLS Content and not other sources of data provided in the Product.
IDX information is provided exclusively for consumers’ personal, non-commercial use, that it may not be used for any purpose other than to identify prospective properties consumers may be interested in purchasing, and that the data is deemed reliable but is not guaranteed accurate by the MLS. Licensor is only providing the MLS Content and not other sources of data provided in the Product.
Based on information from the Wasatch Front Regional Multiple Listing Service, Inc.. All data, including all measurements and calculations of area, is obtained from various sources and has not been, and will not be, verified by broker or the MLS. All information should be independently reviewed and verified for accuracy. Properties may or may not be listed by the office/agent presenting the information.
