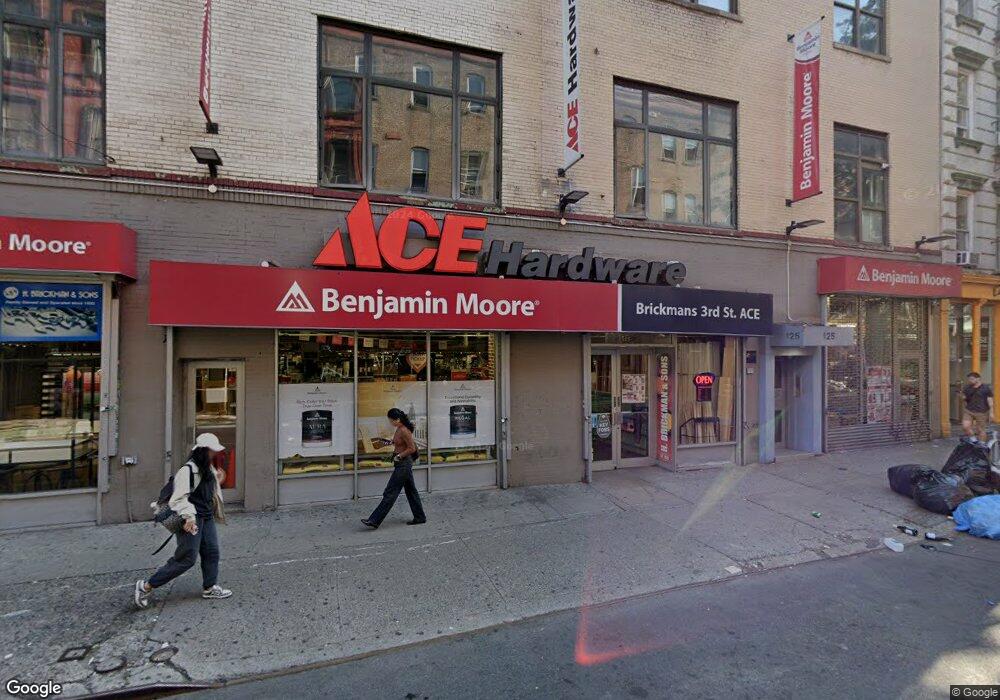
125 W 3rd St New York, NY 10012
Greenwich Village NeighborhoodEstimated Value: $14,864,522
--
Bed
--
Bath
113,754
Sq Ft
$131/Sq Ft
Est. Value
About This Home
This home is located at 125 W 3rd St, New York, NY 10012 and is currently priced at $14,864,522, approximately $130 per square foot. 125 W 3rd St is a home located in New York County with nearby schools including P.S. 3 Charrette School, Middle School 297, and Clinton School.
Ownership History
Date
Name
Owned For
Owner Type
Purchase Details
Closed on
Apr 28, 2005
Sold by
Crystal Tower Llc and % Coral Realty Llc
Bought by
Coral Crystal Llc
Current Estimated Value
Purchase Details
Closed on
Oct 11, 2000
Sold by
Crystal Llc
Bought by
Crystal Tower Llc
Home Financials for this Owner
Home Financials are based on the most recent Mortgage that was taken out on this home.
Original Mortgage
$12,850,000
Outstanding Balance
$4,567,106
Interest Rate
7.75%
Mortgage Type
Commercial
Purchase Details
Closed on
Mar 2, 1999
Sold by
Murphy Hon Francis T
Bought by
Crystal Llc
Purchase Details
Closed on
Jan 9, 1998
Sold by
Pappas John
Bought by
Mcarthur Morgan Llc
Purchase Details
Closed on
Jul 31, 1995
Sold by
Judelson Partners Co
Bought by
L J W P Realty Co Llc
Create a Home Valuation Report for This Property
The Home Valuation Report is an in-depth analysis detailing your home's value as well as a comparison with similar homes in the area
Home Values in the Area
Average Home Value in this Area
Purchase History
| Date | Buyer | Sale Price | Title Company |
|---|---|---|---|
| Coral Crystal Llc | -- | -- | |
| Coral Crystal Llc | -- | -- | |
| Crystal Tower Llc | -- | -- | |
| Crystal Tower Llc | -- | -- | |
| Crystal Llc | $8,200,000 | -- | |
| Crystal Llc | $8,200,000 | -- | |
| Mcarthur Morgan Llc | -- | Commonwealth Land Title Ins | |
| Mcarthur Morgan Llc | -- | Commonwealth Land Title Ins | |
| L J W P Realty Co Llc | -- | Commonwealth Land Title Ins | |
| L J W P Realty Co Llc | -- | Commonwealth Land Title Ins |
Source: Public Records
Mortgage History
| Date | Status | Borrower | Loan Amount |
|---|---|---|---|
| Open | Crystal Tower Llc | $12,850,000 | |
| Closed | Crystal Tower Llc | $12,850,000 |
Source: Public Records
Tax History Compared to Growth
Tax History
| Year | Tax Paid | Tax Assessment Tax Assessment Total Assessment is a certain percentage of the fair market value that is determined by local assessors to be the total taxable value of land and additions on the property. | Land | Improvement |
|---|---|---|---|---|
| 2025 | $1,501,654 | $13,923,270 | $1,165,500 | $12,757,770 |
| 2024 | $1,501,654 | $14,177,250 | $1,165,500 | $13,011,750 |
| 2023 | $1,419,628 | $13,334,850 | $1,165,500 | $12,169,350 |
| 2022 | $1,364,180 | $12,684,150 | $1,165,500 | $11,518,650 |
| 2021 | $1,325,692 | $12,396,600 | $1,165,500 | $11,231,100 |
| 2020 | $1,889,785 | $17,934,750 | $1,165,500 | $16,769,250 |
| 2019 | $1,981,468 | $18,846,000 | $1,165,500 | $17,680,500 |
| 2018 | $1,996,313 | $18,850,500 | $1,165,500 | $17,685,000 |
| 2017 | $1,902,524 | $19,249,650 | $1,165,500 | $18,084,150 |
| 2016 | $1,942,976 | $21,557,250 | $1,165,500 | $20,391,750 |
| 2015 | $972,580 | $18,598,950 | $1,165,500 | $17,433,450 |
| 2014 | $972,580 | $17,382,150 | $1,165,500 | $16,216,650 |
Source: Public Records
Map
Nearby Homes
- 25 Minetta Ln Unit 5C
- 2 Cornelia St Unit 404
- 2 Cornelia St Unit PHA
- 80 W Washington Place
- 290 6th Ave Unit 3CD
- 290 6th Ave Unit 2KL
- 22 Cornelia St Unit 7
- 22 Cornelia St Unit 15
- 24 Cornelia St Unit 13
- 32 Washington Square W Unit 14E
- 69 Washington Place Unit 3/4/5
- 1 Minetta St Unit 5B
- 175 Bleecker St Unit 18
- 122 Waverly Place
- 192 Bleecker St Unit 14
- 211 Thompson St Unit 5L
- 211 Thompson St Unit LJ
- 211 Thompson St Unit 4-C
- 211 Thompson St Unit 5C
- 13 Downing St Unit 9
- 125 W 3rd St Unit 3C
- 125-129 W 3rd St
- 123 W 3rd St
- 123 W 3rd St Unit M
- 123 W 3rd St Unit GG
- 123 W 3rd St Unit OO
- 123 W 3rd St Unit B
- 123 W 3rd St Unit E
- 123 W 3rd St Unit Retail
- 123 W 3rd St Unit I
- 123 W 3rd St Unit P
- 123 W 3rd St Unit K
- 123 W 3rd St Unit D
- 123 W 3rd St Unit G
- 123 W 3rd St Unit J
- 123 W 3rd St Unit N
- 123 W 3rd St Unit H
- 123 W 3rd St Unit 5-P
- 123 W 3rd St Unit F
- 123 W 3rd St Unit L