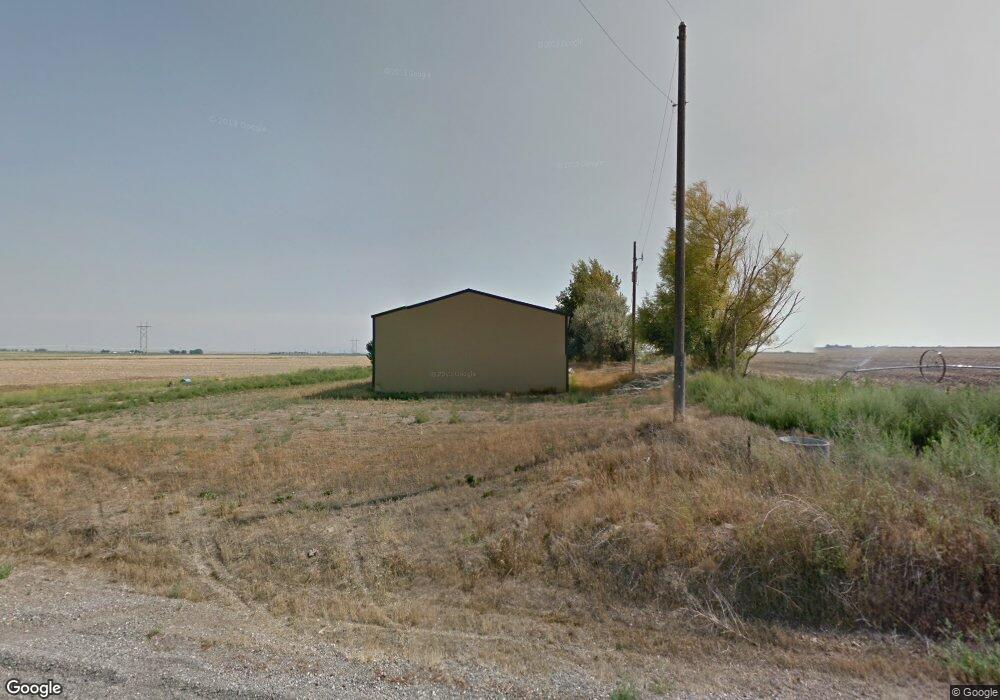
125 W 800 N Rupert, ID 83350
Estimated Value: $413,000 - $521,000
3
Beds
2
Baths
2,866
Sq Ft
$160/Sq Ft
Est. Value
About This Home
This home is located at 125 W 800 N, Rupert, ID 83350 and is currently estimated at $457,128, approximately $159 per square foot. 125 W 800 N is a home located in Minidoka County with nearby schools including Acequia Elementary School and Minico Senior High School.
Ownership History
Date
Name
Owned For
Owner Type
Purchase Details
Closed on
Aug 3, 2022
Sold by
Kenan Idaho Farms Llc
Bought by
T L D Properties Llc and Tall Tucano Properties Llc
Current Estimated Value
Home Financials for this Owner
Home Financials are based on the most recent Mortgage that was taken out on this home.
Original Mortgage
$3,963,400
Outstanding Balance
$3,495,720
Interest Rate
5.3%
Mortgage Type
New Conventional
Estimated Equity
-$3,038,592
Purchase Details
Closed on
Sep 30, 2014
Sold by
R7 Construction Inc
Bought by
Smith Jeffrey A
Home Financials for this Owner
Home Financials are based on the most recent Mortgage that was taken out on this home.
Original Mortgage
$132,015
Interest Rate
4.09%
Mortgage Type
New Conventional
Purchase Details
Closed on
Jul 3, 2014
Sold by
Reed Patrick M and Reed Cindy L
Bought by
R-7 Construction Inc
Create a Home Valuation Report for This Property
The Home Valuation Report is an in-depth analysis detailing your home's value as well as a comparison with similar homes in the area
Home Values in the Area
Average Home Value in this Area
Purchase History
| Date | Buyer | Sale Price | Title Company |
|---|---|---|---|
| T L D Properties Llc | -- | Title One Title | |
| Smith Jeffrey A | $145,014 | Titleone | |
| R-7 Construction Inc | $83,461 | None Available |
Source: Public Records
Mortgage History
| Date | Status | Borrower | Loan Amount |
|---|---|---|---|
| Open | T L D Properties Llc | $3,963,400 | |
| Previous Owner | Smith Jeffrey A | $132,015 |
Source: Public Records
Tax History Compared to Growth
Tax History
| Year | Tax Paid | Tax Assessment Tax Assessment Total Assessment is a certain percentage of the fair market value that is determined by local assessors to be the total taxable value of land and additions on the property. | Land | Improvement |
|---|---|---|---|---|
| 2024 | $1,525 | $406,153 | $51,613 | $354,540 |
| 2023 | $1,214 | $383,363 | $51,613 | $331,750 |
| 2022 | $1,369 | $326,016 | $38,396 | $287,620 |
| 2021 | $1,133 | $258,896 | $33,896 | $225,000 |
| 2020 | $1,280 | $246,866 | $33,896 | $212,970 |
| 2019 | $1,251 | $232,906 | $0 | $0 |
| 2018 | $725 | $139,899 | $27,349 | $112,550 |
| 2017 | $811 | $163,062 | $24,132 | $138,930 |
| 2016 | $702 | $66,036 | $0 | $0 |
| 2015 | -- | $0 | $0 | $0 |
| 2014 | -- | $0 | $0 | $0 |
| 2012 | -- | $0 | $0 | $0 |
Source: Public Records
Map
Nearby Homes