125 W Crovat St Lagrange, GA 30240
Estimated Value: $55,416 - $79,000
1
Bed
1
Bath
576
Sq Ft
$110/Sq Ft
Est. Value
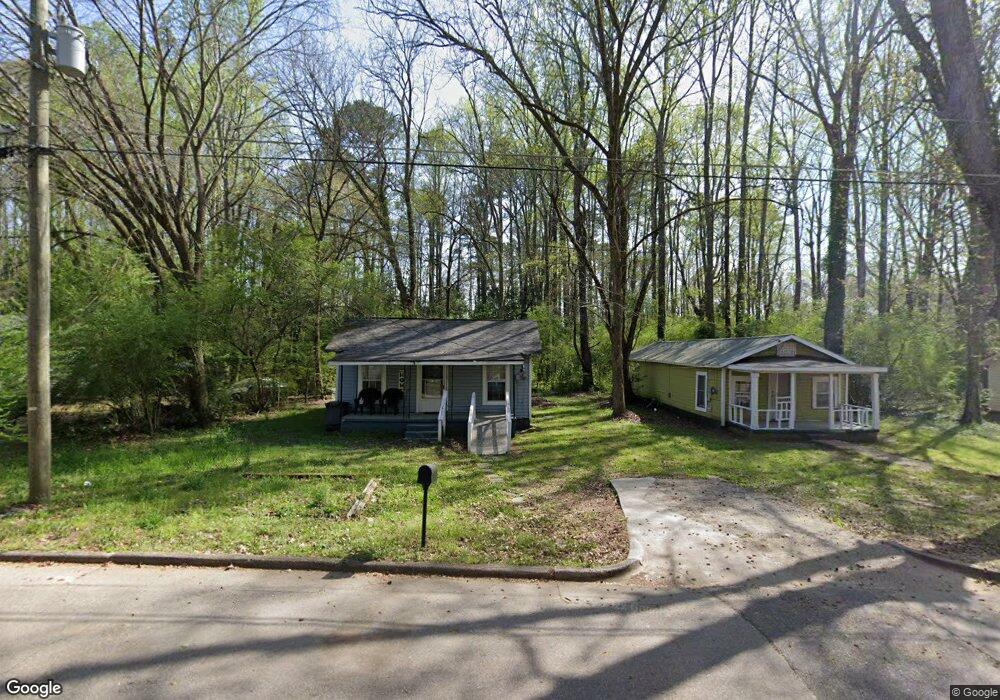
About This Home
This home is located at 125 W Crovat St, Lagrange, GA 30240 and is currently estimated at $63,604, approximately $110 per square foot. 125 W Crovat St is a home located in Troup County with nearby schools including Ethel W. Kight Elementary School, Hollis Hand Elementary School, and Franklin Forest Elementary School.
Ownership History
Date
Name
Owned For
Owner Type
Purchase Details
Closed on
Oct 31, 2017
Sold by
M & L Caldwell Realty Llc
Bought by
Birdayshaw Alan D
Current Estimated Value
Purchase Details
Closed on
May 24, 2006
Sold by
K & R Properties Inc
Bought by
Caldwell Michael J and Caldwell Lynda
Purchase Details
Closed on
Apr 8, 2002
Sold by
Randy Cofield
Bought by
K & R Properties
Purchase Details
Closed on
Feb 25, 1993
Sold by
Cammon Robert B and Cammon Dorothy D
Bought by
Randy Cofield
Purchase Details
Closed on
Feb 1, 1986
Sold by
Moore Nellie and Moore Madeline
Bought by
Cammon Robert B and Cammon Dorothy D
Purchase Details
Closed on
Nov 16, 1980
Sold by
Jackson Raymond D
Bought by
Moore Nellie and Moore Madeline
Purchase Details
Closed on
Nov 15, 1980
Sold by
Lagrange Banking Co
Bought by
Jackson Raymond D
Purchase Details
Closed on
Oct 27, 1977
Sold by
Whitley Nellie
Bought by
Lagrange Banking Co
Purchase Details
Closed on
Jun 1, 1968
Sold by
Hughley Wm D
Bought by
Whitley Nellie
Create a Home Valuation Report for This Property
The Home Valuation Report is an in-depth analysis detailing your home's value as well as a comparison with similar homes in the area
Home Values in the Area
Average Home Value in this Area
Purchase History
| Date | Buyer | Sale Price | Title Company |
|---|---|---|---|
| Birdayshaw Alan D | $7,500 | -- | |
| Caldwell Michael J | $7,500 | -- | |
| K & R Properties | $10,500 | -- | |
| Randy Cofield | $7,500 | -- | |
| Cammon Robert B | $110,000 | -- | |
| Moore Nellie | $4,500 | -- | |
| Jackson Raymond D | -- | -- | |
| Lagrange Banking Co | -- | -- | |
| Whitley Nellie | -- | -- |
Source: Public Records
Tax History Compared to Growth
Tax History
| Year | Tax Paid | Tax Assessment Tax Assessment Total Assessment is a certain percentage of the fair market value that is determined by local assessors to be the total taxable value of land and additions on the property. | Land | Improvement |
|---|---|---|---|---|
| 2024 | $242 | $8,880 | $1,640 | $7,240 |
| 2023 | $207 | $7,600 | $1,640 | $5,960 |
| 2022 | $196 | $7,040 | $1,640 | $5,400 |
| 2021 | $146 | $4,840 | $1,640 | $3,200 |
| 2020 | $146 | $4,840 | $1,640 | $3,200 |
| 2019 | $124 | $4,120 | $1,320 | $2,800 |
| 2018 | $145 | $4,800 | $1,640 | $3,160 |
| 2017 | $150 | $4,979 | $1,700 | $3,279 |
| 2016 | $150 | $4,979 | $1,700 | $3,279 |
| 2015 | $133 | $5,163 | $1,668 | $3,494 |
| 2014 | $151 | $4,979 | $1,668 | $3,310 |
| 2013 | -- | $5,118 | $1,668 | $3,450 |
Source: Public Records
Map
Nearby Homes
- W W Crovat St
- 501 Milam St
- 101 Cedar St
- 303 E Mulberry St
- 109 Bell St
- 914 Todd St
- 206 Peachtree St
- 0 Bagley St
- 0 Boggs St Unit 10550243
- 0 Boggs St Unit 10550231
- 0 Boggs St Unit 10550239
- 0 Boggs St Unit 10550250
- 516 S Lewis St
- 1191 Whitesville St
- 304 Butler St
- 203 Fannin St
- 205 Fannin St
- 509 S Lewis St
- 505 S Lewis St
- 207 Wilkes St
- 127 W Crovat St
- 121 W Crovat St
- 129 W Crovat St
- 0 E Crovat St
- 0 W Crovat St
- 119 W Crovat St
- 124 W Crovat St
- 126 W Crovat St
- 128 W Crovat St
- 201 W Crovat St
- 120 W Crovat St
- 115 W Crovat St
- 514 Milam St
- 205 W Crovat St
- 100 Elizabeth St
- 107 W Crovat St
- 512 Milam St
- 102 Elizabeth St
- 104 W Crovat St
- 204 W Crovat St Unit Ct