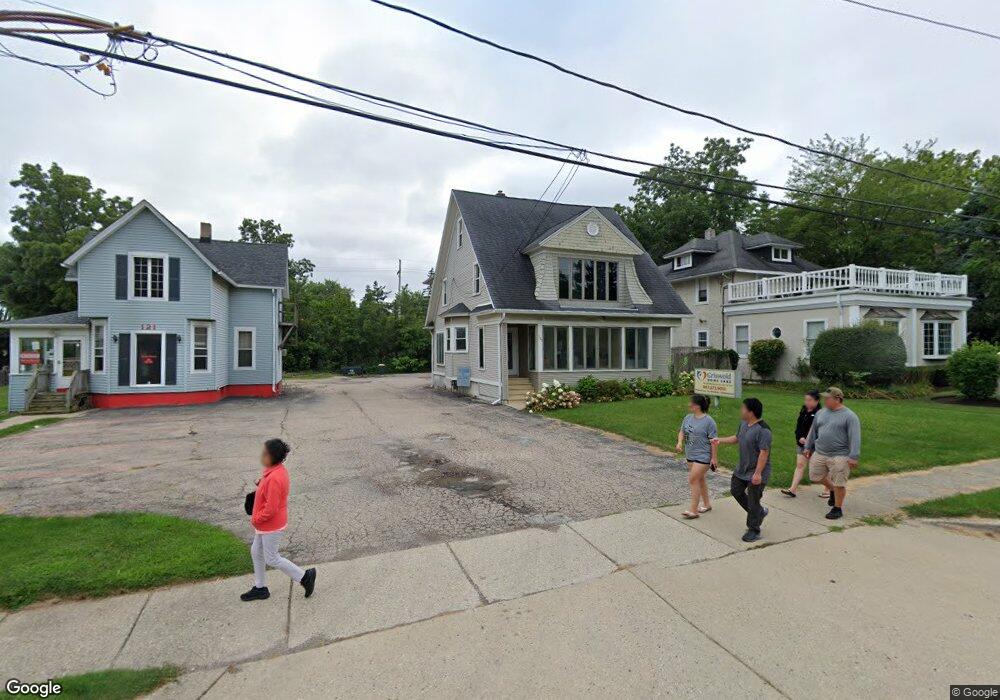
125 W Park Ave Libertyville, IL 60048
South Libertyville NeighborhoodEstimated Value: $773,093
--
Bed
1
Bath
--
Sq Ft
8,538
Sq Ft Lot
About This Home
This home is located at 125 W Park Ave, Libertyville, IL 60048 and is currently estimated at $773,093. 125 W Park Ave is a home located in Lake County with nearby schools including Rockland Elementary School, Highland Middle School, and Libertyville High School.
Ownership History
Date
Name
Owned For
Owner Type
Purchase Details
Closed on
Sep 29, 2023
Sold by
Red Crown Investments Llc-287
Bought by
Deep Rock Land Company Llc-001
Current Estimated Value
Purchase Details
Closed on
Sep 22, 2023
Sold by
Running Scott and Running Michelle
Bought by
Red Crown Investments Llc 287
Purchase Details
Closed on
Sep 3, 2008
Sold by
Clauss Wayne A and Epping Lora T
Bought by
Running Scott and Running Michelle
Purchase Details
Closed on
Aug 12, 2008
Sold by
Epping Clauss Real Estate Partnership
Bought by
Clauss Wayne A and Epping Lora T
Purchase Details
Closed on
Jul 1, 1998
Sold by
Chicago Title Land Trust Company
Bought by
Epping Clauss Real Estate Partnership
Home Financials for this Owner
Home Financials are based on the most recent Mortgage that was taken out on this home.
Original Mortgage
$240,000
Interest Rate
7.75%
Mortgage Type
Commercial
Create a Home Valuation Report for This Property
The Home Valuation Report is an in-depth analysis detailing your home's value as well as a comparison with similar homes in the area
Home Values in the Area
Average Home Value in this Area
Purchase History
| Date | Buyer | Sale Price | Title Company |
|---|---|---|---|
| Deep Rock Land Company Llc-001 | -- | None Listed On Document | |
| Red Crown Investments Llc 287 | $650,000 | First American Title | |
| Running Scott | $620,000 | Multiple | |
| Clauss Wayne A | -- | None Available | |
| Epping Clauss Real Estate Partnership | $240,000 | -- |
Source: Public Records
Mortgage History
| Date | Status | Borrower | Loan Amount |
|---|---|---|---|
| Previous Owner | Epping Clauss Real Estate Partnership | $240,000 |
Source: Public Records
Tax History Compared to Growth
Tax History
| Year | Tax Paid | Tax Assessment Tax Assessment Total Assessment is a certain percentage of the fair market value that is determined by local assessors to be the total taxable value of land and additions on the property. | Land | Improvement |
|---|---|---|---|---|
| 2024 | $10,332 | $139,099 | $57,540 | $81,559 |
| 2023 | $9,862 | $128,296 | $53,071 | $75,225 |
| 2022 | $9,862 | $123,314 | $51,010 | $72,304 |
| 2021 | $9,503 | $120,660 | $49,912 | $70,748 |
| 2020 | $9,151 | $118,632 | $49,073 | $69,559 |
| 2019 | $8,923 | $117,504 | $48,606 | $68,898 |
| 2018 | $8,705 | $116,885 | $48,350 | $68,535 |
| 2017 | $8,477 | $113,195 | $46,824 | $66,371 |
| 2016 | $8,213 | $107,325 | $44,396 | $62,929 |
| 2015 | $8,163 | $100,313 | $41,495 | $58,818 |
| 2014 | $8,219 | $98,967 | $40,938 | $58,029 |
| 2012 | $7,521 | $99,825 | $41,293 | $58,532 |
Source: Public Records
Map
Nearby Homes
- 1754 Glenmore Rd
- 308 Mckinley Ave
- 212 Elm Ct
- 426 S Milwaukee Ave
- 217 E Church St
- 112 3rd St
- 121 4th St
- 551 W Park Ave Unit E
- 505 Lange Ct
- 420 W Cook Ave
- 423 Ames St
- 401 S 4th Ave
- 601 Broadway St
- 0 Ames St
- 224 Newberry Ave
- 785 Meadow Ln
- 533 Drake St
- 922 N Milwaukee Ave Unit A
- 747 Garfield Ave Unit C
- 212 W Ellis Ave
- 131 W Park Ave
- 136 Sunnyside Place
- 136 Sunnyside Place Unit A
- 140 Sunnyside Place
- 147 W Park Ave
- 130 Sunnyside Place
- 130 Sunnyside Place
- 146 Sunnyside Place
- 124 Sunnyside Place
- 152 Sunnyside Place
- 120 Sunnyside Place
- 160 Sunnyside Place
- 129 Sunnyside Place
- 139 Sunnyside Place
- 147 Sunnyside Place
- 141 Sunnyside Place
- 123 Sunnyside Place
- 147 Sunnyside Place
- 119 N Milwaukee Ave
- 117 Sunnyside Place