
Seller's Agent in 2021
Lauren Iraeta
KW Legacy Partners
(860) 670-8047
5 in this area
334 Total Sales
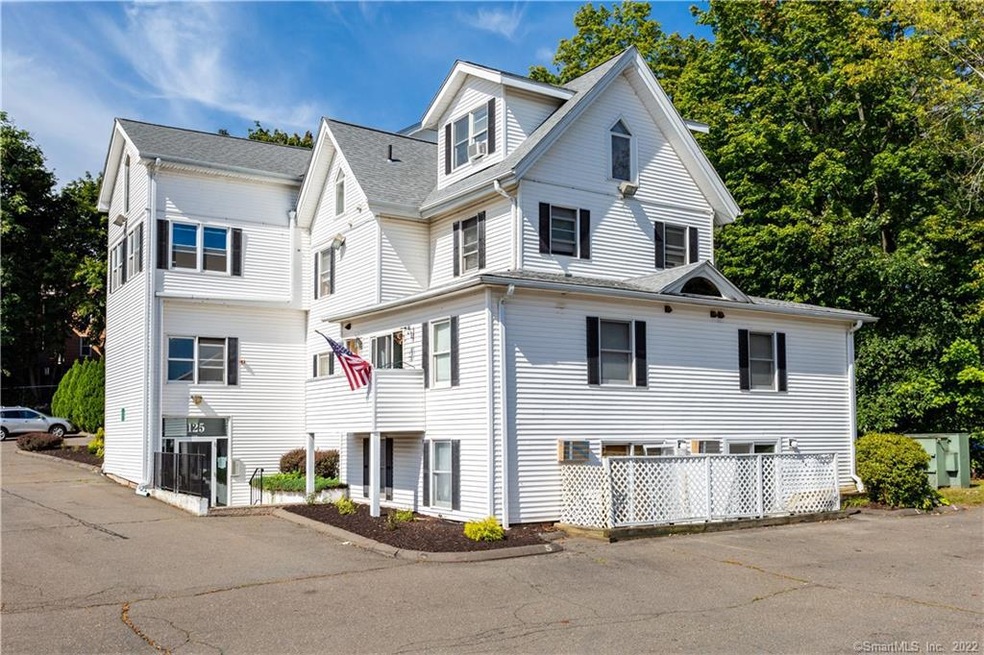
Wonderful 1 bedroom 1 bath first floor unit. Spacious unit with additional room that could be used as a second bedroom. Completely remodeled with new engineered flooring and fresh paint. Open living and dining room area with slider out to private patio. Laundry hook up in unit. Turn key investment with tenants in place. Low condo fees and taxes!Agent/Owner
Last Agent to Sell the Property
KW Legacy Partners License #RES.0780591 Listed on: 07/12/2021
| Date | Type | Sale Price | Title Company |
|---|---|---|---|
| Warranty Deed | $35,000 | -- | |
| Warranty Deed | $45,000 | -- | |
| Not Resolvable | $48,000 | -- |
| Date | Event | Price | Change | Sq Ft Price |
|---|---|---|---|---|
| 11/01/2021 11/01/21 | Sold | $60,000 | -7.6% | $89 / Sq Ft |
| 10/02/2021 10/02/21 | Pending | -- | -- | -- |
| 09/12/2021 09/12/21 | Price Changed | $64,900 | -7.2% | $97 / Sq Ft |
| 07/12/2021 07/12/21 | For Sale | $69,900 | 0.0% | $104 / Sq Ft |
| 12/13/2019 12/13/19 | Rented | $850 | +3.0% | -- |
| 11/18/2019 11/18/19 | Price Changed | $825 | -2.9% | $1 / Sq Ft |
| 10/15/2019 10/15/19 | Price Changed | $850 | -2.9% | $1 / Sq Ft |
| 09/27/2019 09/27/19 | Price Changed | $875 | -2.8% | $1 / Sq Ft |
| 09/10/2019 09/10/19 | Price Changed | $900 | -5.3% | $1 / Sq Ft |
| 08/28/2019 08/28/19 | For Rent | $950 | +11.8% | -- |
| 10/15/2018 10/15/18 | Rented | $850 | 0.0% | -- |
| 10/05/2018 10/05/18 | Price Changed | $850 | -5.6% | $1 / Sq Ft |
| 09/18/2018 09/18/18 | For Rent | $900 | 0.0% | -- |
| 05/31/2018 05/31/18 | Sold | $35,000 | -42.1% | $52 / Sq Ft |
| 05/17/2018 05/17/18 | Pending | -- | -- | -- |
| 04/19/2018 04/19/18 | For Sale | $60,400 | 0.0% | $90 / Sq Ft |
| 03/28/2017 03/28/17 | Rented | $700 | -6.7% | -- |
| 03/21/2017 03/21/17 | For Rent | $750 | +7.1% | -- |
| 07/20/2016 07/20/16 | Rented | $700 | 0.0% | -- |
| 07/16/2016 07/16/16 | Under Contract | -- | -- | -- |
| 07/12/2016 07/12/16 | For Rent | $700 | 0.0% | -- |
| 06/29/2015 06/29/15 | Rented | $700 | 0.0% | -- |
| 05/30/2015 05/30/15 | Under Contract | -- | -- | -- |
| 05/12/2015 05/12/15 | For Rent | $700 | +7.7% | -- |
| 07/06/2013 07/06/13 | Rented | $650 | -7.1% | -- |
| 07/06/2013 07/06/13 | Under Contract | -- | -- | -- |
| 06/21/2013 06/21/13 | For Rent | $700 | -- | -- |
| Year | Tax Paid | Tax Assessment Tax Assessment Total Assessment is a certain percentage of the fair market value that is determined by local assessors to be the total taxable value of land and additions on the property. | Land | Improvement |
|---|---|---|---|---|
| 2025 | $1,772 | $52,500 | $0 | $52,500 |
| 2024 | $1,672 | $52,500 | $0 | $52,500 |
| 2023 | $1,593 | $52,500 | $0 | $52,500 |
| 2022 | $1,498 | $39,060 | $0 | $39,060 |
| 2021 | $1,498 | $39,060 | $0 | $39,060 |
| 2020 | $1,498 | $39,060 | $0 | $39,060 |
| 2019 | $1,486 | $39,060 | $0 | $39,060 |
| 2018 | $1,441 | $39,060 | $0 | $39,060 |
| 2017 | $1,523 | $42,280 | $0 | $42,280 |
| 2016 | $1,523 | $42,280 | $0 | $42,280 |
| 2015 | $1,463 | $42,280 | $0 | $42,280 |
| 2014 | $1,463 | $42,280 | $0 | $42,280 |
Seller's Agent in 2021
Lauren Iraeta
KW Legacy Partners
(860) 670-8047
5 in this area
334 Total Sales
Buyer's Agent in 2021
Rita Mercier
Central Connecticut Realtors
(203) 530-5228
6 in this area
64 Total Sales
Seller's Agent in 2018
Ronald Forcier
Century 21 AllPoints Realty
(860) 543-3189
97 Total Sales
Buyer's Agent in 2018
Joseph Snell
Luxe Realty LLC
(860) 839-8331
282 Total Sales
B
Buyer's Agent in 2013
Brett Toczko
Home Valley Realty, LLC
Source: SmartMLS
MLS Number: 170417026
APN: BRIS-000029-000000-000062-000002
Disclaimer: Certain information contained herein is derived from information provided by parties other than Homes.com. All information provided is deemed reliable, but is not guaranteed to be accurate and should be independently verified.
![]() IDX information is provided exclusively for personal, non-commercial use, and may not be used for any purpose other than to identify prospective properties consumers may be interested in purchasing. Information is deemed reliable but not guaranteed.
IDX information is provided exclusively for personal, non-commercial use, and may not be used for any purpose other than to identify prospective properties consumers may be interested in purchasing. Information is deemed reliable but not guaranteed.