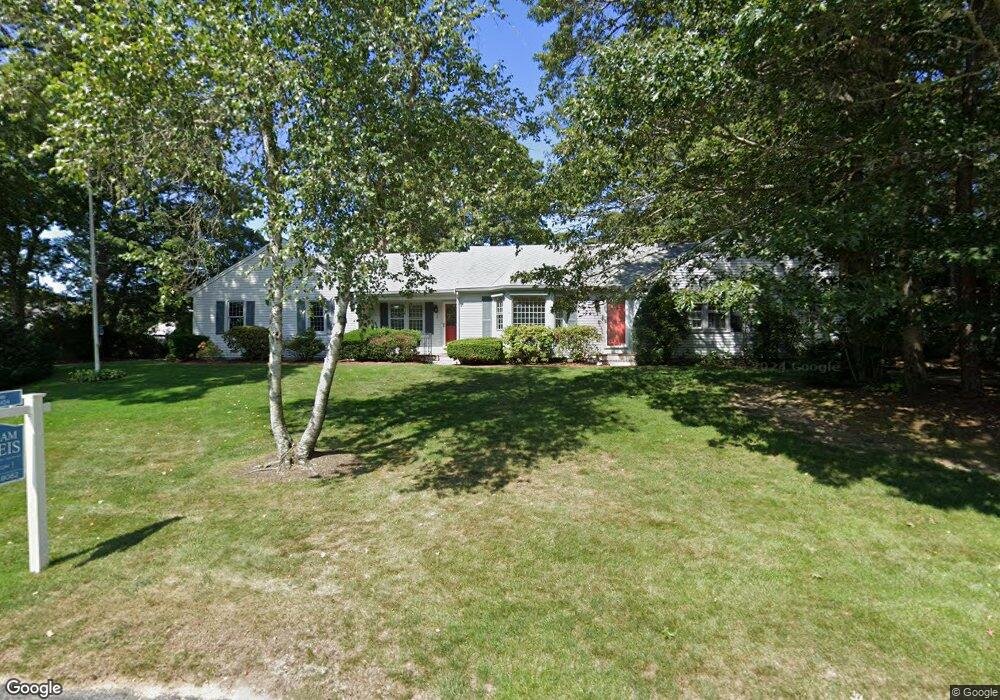
125 Wianno Rd Yarmouth Port, MA 02675
Yarmouth Port NeighborhoodEstimated Value: $718,000 - $822,000
3
Beds
3
Baths
1,725
Sq Ft
$449/Sq Ft
Est. Value
About This Home
This home is located at 125 Wianno Rd, Yarmouth Port, MA 02675 and is currently estimated at $774,234, approximately $448 per square foot. 125 Wianno Rd is a home located in Barnstable County with nearby schools including Dennis-Yarmouth Regional High School.
Ownership History
Date
Name
Owned For
Owner Type
Purchase Details
Closed on
Jun 22, 2021
Sold by
Philbrook Andrew H
Bought by
Andrew Howe Philbrook Lt and Howe-Philbrook
Current Estimated Value
Purchase Details
Closed on
Oct 3, 2018
Sold by
Philbrook Andrew H and Philbrook Angela R
Bought by
Philbrook Andrew H
Purchase Details
Closed on
Sep 5, 2013
Sold by
Philbrook T V T and Philbrook Kelley C
Bought by
Philbrook Andrew H and Philbrook Angela R
Purchase Details
Closed on
Jun 21, 1999
Sold by
Elizabeth C Sprague T C and Elizabeth Sprague
Bought by
Laviolette David P and Laviolette Carol S
Home Financials for this Owner
Home Financials are based on the most recent Mortgage that was taken out on this home.
Original Mortgage
$50,000
Interest Rate
6.99%
Mortgage Type
Purchase Money Mortgage
Purchase Details
Closed on
Aug 27, 1996
Sold by
Dawley Walter
Bought by
Elizabeth Sprague T and Elizabeth Sprague
Create a Home Valuation Report for This Property
The Home Valuation Report is an in-depth analysis detailing your home's value as well as a comparison with similar homes in the area
Home Values in the Area
Average Home Value in this Area
Purchase History
| Date | Buyer | Sale Price | Title Company |
|---|---|---|---|
| Andrew Howe Philbrook Lt | -- | None Available | |
| Philbrook Andrew H | -- | -- | |
| Philbrook Andrew H | $340,000 | -- | |
| Philbrook Andrew H | $340,000 | -- | |
| Philbrook Andrew H | $340,000 | -- | |
| Philbrook Andrew H | $340,000 | -- | |
| Laviolette David P | $212,000 | -- | |
| Laviolette David P | $212,000 | -- | |
| Elizabeth Sprague T | $55,000 | -- | |
| Elizabeth Sprague T | $55,000 | -- |
Source: Public Records
Mortgage History
| Date | Status | Borrower | Loan Amount |
|---|---|---|---|
| Previous Owner | Elizabeth Sprague T | $225,000 | |
| Previous Owner | Laviolette David P | $50,000 | |
| Closed | Philbrook Andrew H | $0 | |
| Closed | Philbrook Andrew H | -- |
Source: Public Records
Tax History Compared to Growth
Tax History
| Year | Tax Paid | Tax Assessment Tax Assessment Total Assessment is a certain percentage of the fair market value that is determined by local assessors to be the total taxable value of land and additions on the property. | Land | Improvement |
|---|---|---|---|---|
| 2025 | $4,693 | $662,900 | $168,200 | $494,700 |
| 2024 | $4,354 | $590,000 | $146,300 | $443,700 |
| 2023 | $4,336 | $534,700 | $132,900 | $401,800 |
| 2022 | $4,101 | $446,700 | $126,700 | $320,000 |
| 2021 | $4,011 | $419,600 | $126,700 | $292,900 |
| 2020 | $3,916 | $391,600 | $134,100 | $257,500 |
| 2019 | $3,640 | $360,400 | $134,100 | $226,300 |
| 2018 | $3,478 | $338,000 | $111,700 | $226,300 |
| 2017 | $3,387 | $338,000 | $111,700 | $226,300 |
| 2016 | $3,284 | $329,100 | $102,800 | $226,300 |
| 2015 | $3,194 | $318,100 | $98,300 | $219,800 |
Source: Public Records
Map
Nearby Homes
- 20 Trophy Ln
- 800 Route 6a
- 800 Route 6a
- 6 Nimble Hill Dr
- 21 Boxwood Cir
- 64 Kates Path
- 4208 Heatherwood
- 17 Kates Path Unit A
- 14 Many Oaks Cir
- 228 Kates Path
- 28 Oak Glen
- 25 Oak Glen
- 25 Oak Glen Village Unit 25
- 13 Covey Dr
- 15 Follins Pond Rd
- 158 Kates Path
- 19 John Halls Cartpath Village Unit E
- 19 John Hall Cartway Unit E
- 42 John Hall Cartway Unit 42
- 2 Pine Grove