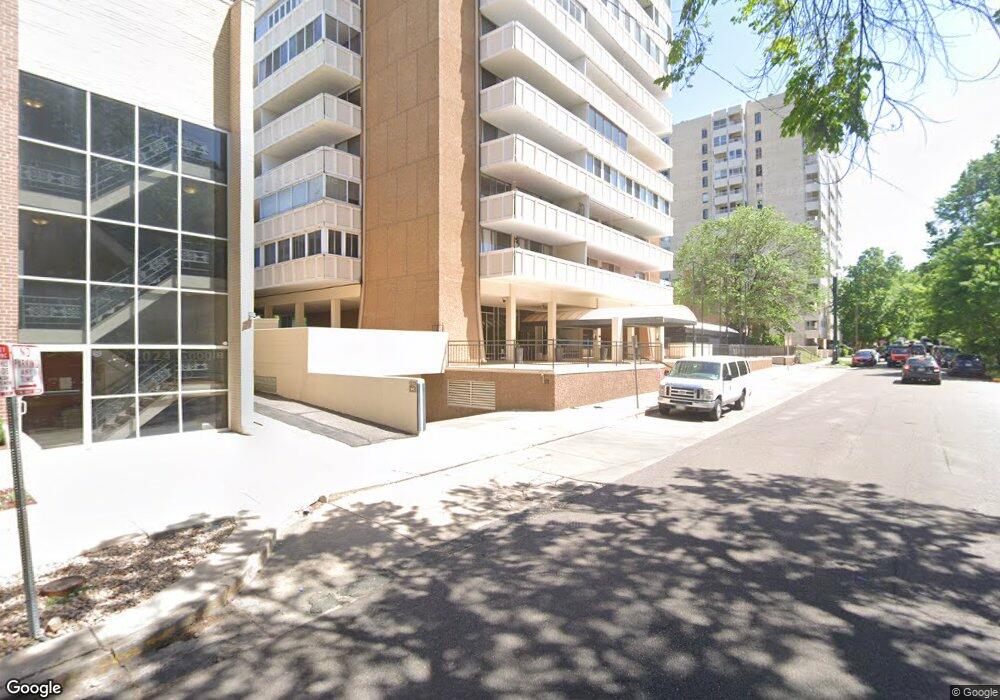
1250 Humboldt St Unit 1404 Denver, CO 80218
Cheesman Park NeighborhoodEstimated Value: $497,686 - $616,000
2
Beds
2
Baths
1,164
Sq Ft
$471/Sq Ft
Est. Value
About This Home
This home is located at 1250 Humboldt St Unit 1404, Denver, CO 80218 and is currently estimated at $547,922, approximately $470 per square foot. 1250 Humboldt St Unit 1404 is a home located in Denver County with nearby schools including Dora Moore ECE-8 School, Morey Middle School, and East High School.
Ownership History
Date
Name
Owned For
Owner Type
Purchase Details
Closed on
Apr 1, 2015
Sold by
Lyden Cyndi and Bregman Paul S
Bought by
Morris Thomas E and Dodson Dona T
Current Estimated Value
Purchase Details
Closed on
Aug 28, 2009
Sold by
Gloekler Ronald B
Bought by
Bregman Paul
Home Financials for this Owner
Home Financials are based on the most recent Mortgage that was taken out on this home.
Original Mortgage
$216,015
Interest Rate
5.14%
Mortgage Type
FHA
Purchase Details
Closed on
Mar 27, 2002
Sold by
Lund Laurel
Bought by
Gloekler Ronald B
Purchase Details
Closed on
Oct 23, 2000
Sold by
Love John A
Bought by
Lund Laurel
Home Financials for this Owner
Home Financials are based on the most recent Mortgage that was taken out on this home.
Original Mortgage
$171,600
Interest Rate
7.89%
Create a Home Valuation Report for This Property
The Home Valuation Report is an in-depth analysis detailing your home's value as well as a comparison with similar homes in the area
Home Values in the Area
Average Home Value in this Area
Purchase History
| Date | Buyer | Sale Price | Title Company |
|---|---|---|---|
| Morris Thomas E | $364,900 | Chicago Title Co | |
| Bregman Paul | $220,000 | Stewart Title | |
| Gloekler Ronald B | $220,000 | Land Title | |
| Lund Laurel | $214,500 | Land Title |
Source: Public Records
Mortgage History
| Date | Status | Borrower | Loan Amount |
|---|---|---|---|
| Previous Owner | Bregman Paul | $216,015 | |
| Previous Owner | Lund Laurel | $171,600 |
Source: Public Records
Tax History Compared to Growth
Tax History
| Year | Tax Paid | Tax Assessment Tax Assessment Total Assessment is a certain percentage of the fair market value that is determined by local assessors to be the total taxable value of land and additions on the property. | Land | Improvement |
|---|---|---|---|---|
| 2024 | $2,751 | $34,730 | $1,520 | $33,210 |
| 2023 | $2,691 | $34,730 | $1,520 | $33,210 |
| 2022 | $2,628 | $33,040 | $1,580 | $31,460 |
| 2021 | $2,536 | $33,990 | $1,620 | $32,370 |
| 2020 | $2,393 | $32,250 | $1,430 | $30,820 |
| 2019 | $2,326 | $32,250 | $1,430 | $30,820 |
| 2018 | $2,293 | $29,640 | $1,350 | $28,290 |
| 2017 | $2,286 | $29,640 | $1,350 | $28,290 |
| 2016 | $1,978 | $24,250 | $1,274 | $22,976 |
| 2015 | $1,895 | $24,250 | $1,274 | $22,976 |
| 2014 | $1,527 | $18,380 | $1,003 | $17,377 |
Source: Public Records
Map
Nearby Homes
- 1250 N Humboldt St Unit 805
- 1200 N Humboldt St Unit 303
- 1200 N Humboldt St Unit 305
- 1200 N Humboldt St Unit 604
- 1320 N Humboldt St
- 1327 N Humboldt St
- 1231 N Lafayette St
- 1337 N Humboldt St
- 1345 Franklin St
- 1270 N Marion St Unit 505
- 1337 N Lafayette St
- 1373 N Franklin St Unit 3
- 1201 N Williams St Unit 2A
- 1201 N Williams St Unit 17A
- 1201 N Williams St Unit 2B
- 1313 N Williams St Unit 1602
- 1151 N Marion St Unit 104
- 1090 N Lafayette St Unit 503
- 1438 Franklin St Unit 100
- 1441 N Humboldt St Unit 507
- 1250 Humboldt St Unit 1900
- 1250 Humboldt St
- 1250 Humboldt St
- 1250 Humboldt St Unit 1605
- 1250 Humboldt St
- 1250 Humboldt St
- 1250 Humboldt St Unit 1602
- 1250 Humboldt St
- 1250 Humboldt St
- 1250 Humboldt St Unit 1504
- 1250 Humboldt St Unit 1503
- 1250 Humboldt St Unit 1502
- 1250 Humboldt St Unit 1501
- 1250 Humboldt St Unit 1405
- 1250 Humboldt St Unit 1403
- 1250 Humboldt St Unit 1402
- 1250 Humboldt St Unit 1401
- 1250 Humboldt St
- 1250 Humboldt St Unit 1304
- 1250 Humboldt St