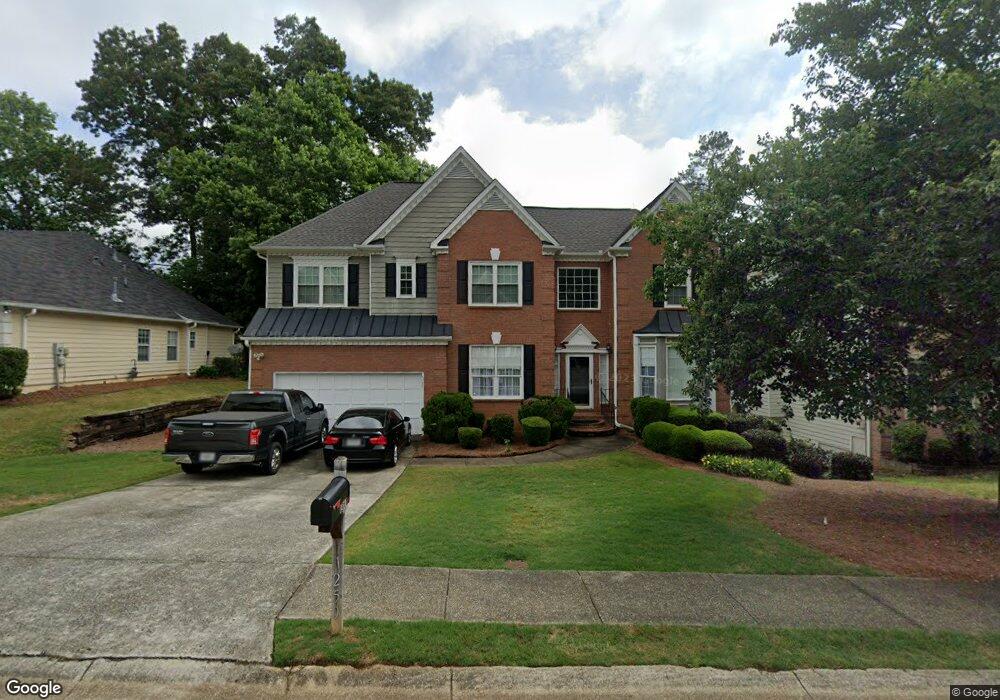
1250 Killian Shoals Way SW Lilburn, GA 30047
Estimated Value: $507,000 - $545,000
4
Beds
3
Baths
2,651
Sq Ft
$200/Sq Ft
Est. Value
About This Home
This home is located at 1250 Killian Shoals Way SW, Lilburn, GA 30047 and is currently estimated at $531,474, approximately $200 per square foot. 1250 Killian Shoals Way SW is a home located in Gwinnett County with nearby schools including Head Elementary School, Five Forks Middle School, and Brookwood High School.
Ownership History
Date
Name
Owned For
Owner Type
Purchase Details
Closed on
Jul 6, 2007
Sold by
Negede Muluneh M
Bought by
Negede Muluneh and Gile Saba
Current Estimated Value
Home Financials for this Owner
Home Financials are based on the most recent Mortgage that was taken out on this home.
Original Mortgage
$227,200
Outstanding Balance
$140,819
Interest Rate
6.52%
Mortgage Type
New Conventional
Estimated Equity
$390,655
Purchase Details
Closed on
Dec 1, 2004
Sold by
Held Thomas J and Held Laura
Bought by
Negede Muluneh M
Home Financials for this Owner
Home Financials are based on the most recent Mortgage that was taken out on this home.
Original Mortgage
$180,000
Interest Rate
5.57%
Mortgage Type
New Conventional
Purchase Details
Closed on
Sep 15, 1995
Sold by
Horton D R Inc
Bought by
Erickson David L Patricia
Create a Home Valuation Report for This Property
The Home Valuation Report is an in-depth analysis detailing your home's value as well as a comparison with similar homes in the area
Home Values in the Area
Average Home Value in this Area
Purchase History
| Date | Buyer | Sale Price | Title Company |
|---|---|---|---|
| Negede Muluneh | -- | -- | |
| Negede Muluneh M | $225,000 | -- | |
| Erickson David L Patricia | $174,000 | -- |
Source: Public Records
Mortgage History
| Date | Status | Borrower | Loan Amount |
|---|---|---|---|
| Open | Negede Muluneh | $227,200 | |
| Previous Owner | Negede Muluneh M | $180,000 |
Source: Public Records
Tax History Compared to Growth
Tax History
| Year | Tax Paid | Tax Assessment Tax Assessment Total Assessment is a certain percentage of the fair market value that is determined by local assessors to be the total taxable value of land and additions on the property. | Land | Improvement |
|---|---|---|---|---|
| 2025 | $5,429 | $207,880 | $36,000 | $171,880 |
| 2024 | $5,406 | $199,520 | $36,000 | $163,520 |
| 2023 | $5,406 | $156,440 | $32,000 | $124,440 |
| 2022 | $4,486 | $156,440 | $32,000 | $124,440 |
| 2021 | $3,921 | $126,000 | $20,400 | $105,600 |
| 2020 | $3,950 | $126,000 | $20,400 | $105,600 |
| 2019 | $3,852 | $126,000 | $20,400 | $105,600 |
| 2018 | $3,012 | $87,040 | $18,400 | $68,640 |
| 2016 | $3,030 | $87,040 | $18,400 | $68,640 |
| 2015 | $2,839 | $77,040 | $9,200 | $67,840 |
| 2014 | $2,449 | $65,484 | $7,820 | $57,664 |
Source: Public Records
Map
Nearby Homes
- 1315 Killian Shoals Way SW
- 3884 Meandering Way SW Unit 1
- 3846 Teresa Terrace SW
- 1394 Rustlewood Ct SW
- 1043 Wash Lee Dr SW
- 1102 Timber Glen Ct SW
- 978 Gwens Trail SW
- 1093 Hasty Ct SW
- 1535 Pathfinder Way SW Unit 1
- 4070 Runnymede Dr SW
- 4449 Amberleaf Walk
- 4327 Saint Michaels Dr SW
- 1640 Killian Hill Rd SW
- 3868 Buckland Dr SW
- 4271 Weston Dr SW
- 1725 Spindle Top Ct SW
- 1260 Killian Shoals Way SW
- 1240 Killian Shoals Way SW
- 1260 1260 Killian Shoals Way
- 1263 Killian Knoll Cir SW Unit 2
- 1270 Killian Shoals Way SW Unit 1
- 1273 Killian Knoll Cir SW
- 3880 Colonial Trail SW
- 1255 Killian Shoals Way SW Unit I
- 3870 Colonial Trail SW
- 1265 Killian Shoals Way SW
- 0 Killian Shoals Way SW Unit 7035711
- 0 Killian Shoals Way SW Unit 8877137
- 0 Killian Shoals Way SW Unit 3172840
- 0 Killian Shoals Way SW Unit 3252948
- 0 Killian Shoals Way SW Unit 8297236
- 3910 Colonial Trail SW
- 1253 Killian Knoll Cir SW Unit 2
- 3860 Colonial Trail SW Unit 2
- 1275 Killian Shoals Way SW
- 3920 Colonial Trail SW Unit I