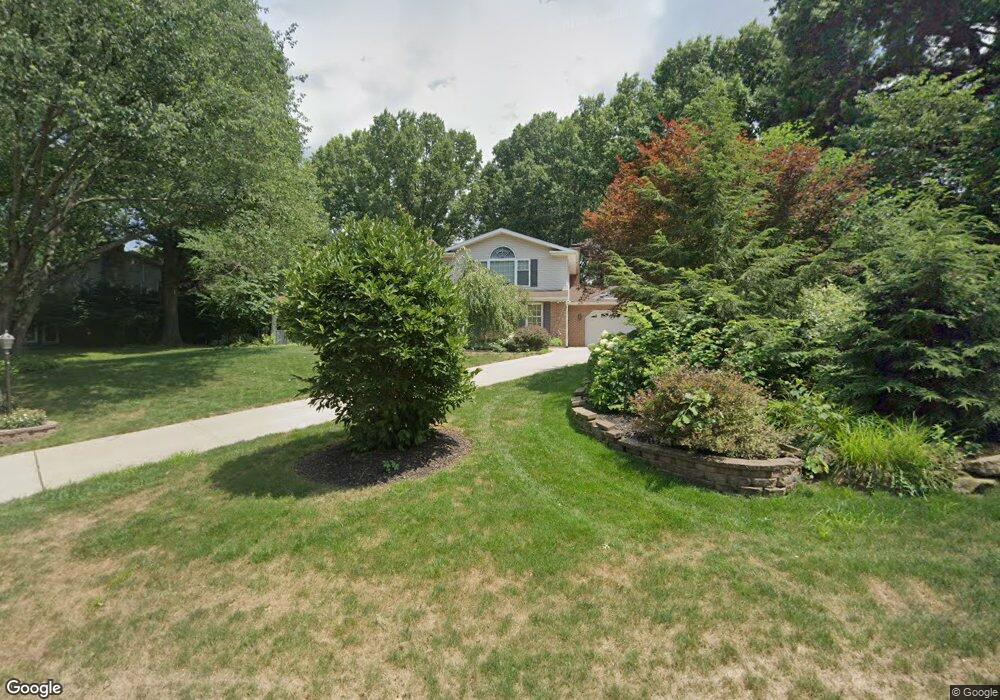
1250 Lorrell Ave SW North Canton, OH 44720
Mount Vernon NeighborhoodEstimated Value: $389,000 - $462,000
4
Beds
4
Baths
3,604
Sq Ft
$114/Sq Ft
Est. Value
About This Home
This home is located at 1250 Lorrell Ave SW, North Canton, OH 44720 and is currently estimated at $410,382, approximately $113 per square foot. 1250 Lorrell Ave SW is a home located in Stark County with nearby schools including Orchard Hill Intermediate School, North Canton Middle School, and Hoover High School.
Ownership History
Date
Name
Owned For
Owner Type
Purchase Details
Closed on
Jul 23, 2009
Sold by
Mulig Mccabe Ann M and Mccabe Michael C
Bought by
Mccabe Michael E and Mulig Mccabe Ann M
Current Estimated Value
Home Financials for this Owner
Home Financials are based on the most recent Mortgage that was taken out on this home.
Original Mortgage
$172,975
Interest Rate
5.43%
Mortgage Type
FHA
Purchase Details
Closed on
Oct 16, 1992
Create a Home Valuation Report for This Property
The Home Valuation Report is an in-depth analysis detailing your home's value as well as a comparison with similar homes in the area
Home Values in the Area
Average Home Value in this Area
Purchase History
| Date | Buyer | Sale Price | Title Company |
|---|---|---|---|
| Mccabe Michael E | -- | Attorney | |
| -- | $123,000 | -- |
Source: Public Records
Mortgage History
| Date | Status | Borrower | Loan Amount |
|---|---|---|---|
| Previous Owner | Mccabe Michael E | $172,975 |
Source: Public Records
Tax History Compared to Growth
Tax History
| Year | Tax Paid | Tax Assessment Tax Assessment Total Assessment is a certain percentage of the fair market value that is determined by local assessors to be the total taxable value of land and additions on the property. | Land | Improvement |
|---|---|---|---|---|
| 2025 | -- | $137,730 | $25,730 | $112,000 |
| 2024 | -- | $137,730 | $25,730 | $112,000 |
| 2023 | $5,251 | $98,210 | $19,320 | $78,890 |
| 2022 | $5,044 | $98,210 | $19,320 | $78,890 |
| 2021 | $4,865 | $98,210 | $19,320 | $78,890 |
| 2020 | $4,624 | $83,830 | $16,800 | $67,030 |
| 2019 | $4,316 | $83,840 | $16,810 | $67,030 |
| 2018 | $4,476 | $83,840 | $16,810 | $67,030 |
| 2017 | $4,189 | $82,430 | $16,380 | $66,050 |
| 2016 | $4,205 | $82,430 | $16,380 | $66,050 |
| 2015 | $4,220 | $82,430 | $16,380 | $66,050 |
| 2014 | $48 | $73,790 | $14,670 | $59,120 |
| 2013 | $2,028 | $73,790 | $14,670 | $59,120 |
Source: Public Records
Map
Nearby Homes
- 1138 Lindy Lane Ave SW
- 820 Glenwood St SW
- 1443 Wilkshire Cir SW
- 923 Hillcrest Ave SW
- 727 Lorena St SW
- 0 Elberta Ave SW
- 326 Bachtel St SW
- 236 Rose Lane St SW
- 218 Bonnett St SW
- 1246 W Maple St Unit 4A
- 256 Everhard Rd SW
- 0 W Maple St Unit 5135089
- 139 Maplecrest St SW
- VL Edgemont St NW
- 201 Parkview Ave NW
- 1171 Terrace Rd NW
- 303 W Park Rd NW
- 742 Portage St NW
- 4628 Westwood Ave NW
- 4646 Woodside Ave NW
- 1264 Lorrell Ave SW
- 1238 Lorrell Ave SW
- 1251 Salway Ave SW
- 1276 Lorrell Ave SW
- 1265 Lorrell Ave SW
- 1271 Salway Ave SW
- 1247 Lorrell Ave SW
- 1231 Lorrell Ave SW
- 1283 Salway Ave SW
- 1277 Lorrell Ave SW
- 1232 Salway Ave SW
- 1246 Salway Ave SW
- 1220 Salway Ave SW
- 1292 Lorrell Ave SW
- 1206 Salway Ave SW
- 1295 Lorrell Ave SW
- 1195 Salway Ave SW
- 1299 Salway Ave SW
- 1200 Salway Ave SW
- 1302 Lorrell Ave SW